
Beyond Payrolls: The Real-Time Foot Traffic Read on Labor Softness

Macro Insights
QuantCube’s latest insights into the US economic outlook
Summary
Financial markets have spent the past month recalibrating expectations for US monetary policy. Investors now assign roughly a 70% probability that the Fed does not deliver a third consecutive rate cut – a notable shift from the confidence seen earlier in the autumn. Chair Powell’s October press conference, reinforced by subsequent FOMC communications and the latest minutes, has pushed markets toward a straightforward conclusion: without hard data, the Fed will not pre-commit.
The difficulty is that, now, hard data is unavailable. The federal shutdown has suspended access to several of the labour-market series the Fed relies on most, and the crucial November nonfarm payrolls (NFP) print will now arrive after the December FOMC meeting. Investors are therefore forced to navigate a data vacuum filled largely by surveys and alternative indicators - many of which point in different directions.
Conflicting Signals from Traditional Surveys
Recent survey releases illustrate the challenge:
The ISM non-manufacturing employment index recovered in October after earlier weakness.
The NFIB small-business survey indicates rising unemployment.
The University of Michigan survey shows households becoming markedly more pessimistic about future job prospects.
This dispersion highlights a structural issue: surveys are increasingly capturing sentiment noise, not underlying labour demand. With political uncertainty, regulatory shifts, and sector-specific disruptions shaping expectations, sentiment is especially volatile. To cut through this, we shift focus from perceptions to behavioural indicators.
Foot Traffic as a Real-Time Coincident Signal
QuantCube’s labour-market monitoring relies on pedestrian flows to employment-related service locations. These include temporary-work and staffing agencies, private recruitment firms, and the nationwide network of American Job Centers. Foot traffic to these locations provides a behavioural measure of job-search activity that becomes visible well before changes appear in unemployment claims or payrolls data.
Recent patterns point to a labour market that is cooling gradually. Visits to employment-service locations have risen steadily throughout 2025. The increase is not dramatic, but is clearly persistent and visible beyond seasonal patterns. Although long-term historical comparability is limited – with 2020 still distorting pre-pandemic baselines – the trend is unmistakable: job-search intensity has strengthened over the course of the year.

The signals are not uniform across all types of centers (Exhibit 2). Footfall at private employment agencies has risen more strongly than at American Job Centers. Job Centers often capture job loss and benefit-related activity; their more muted rise suggests that job destruction has increased, but not dramatically. Private-agency visits tend to reflect job-switching, temporary assignments, and precautionary search behaviour triggered by uncertainty or financial pressure. The divergence implies a labour market where demand is softening, even if layoffs remain contained.

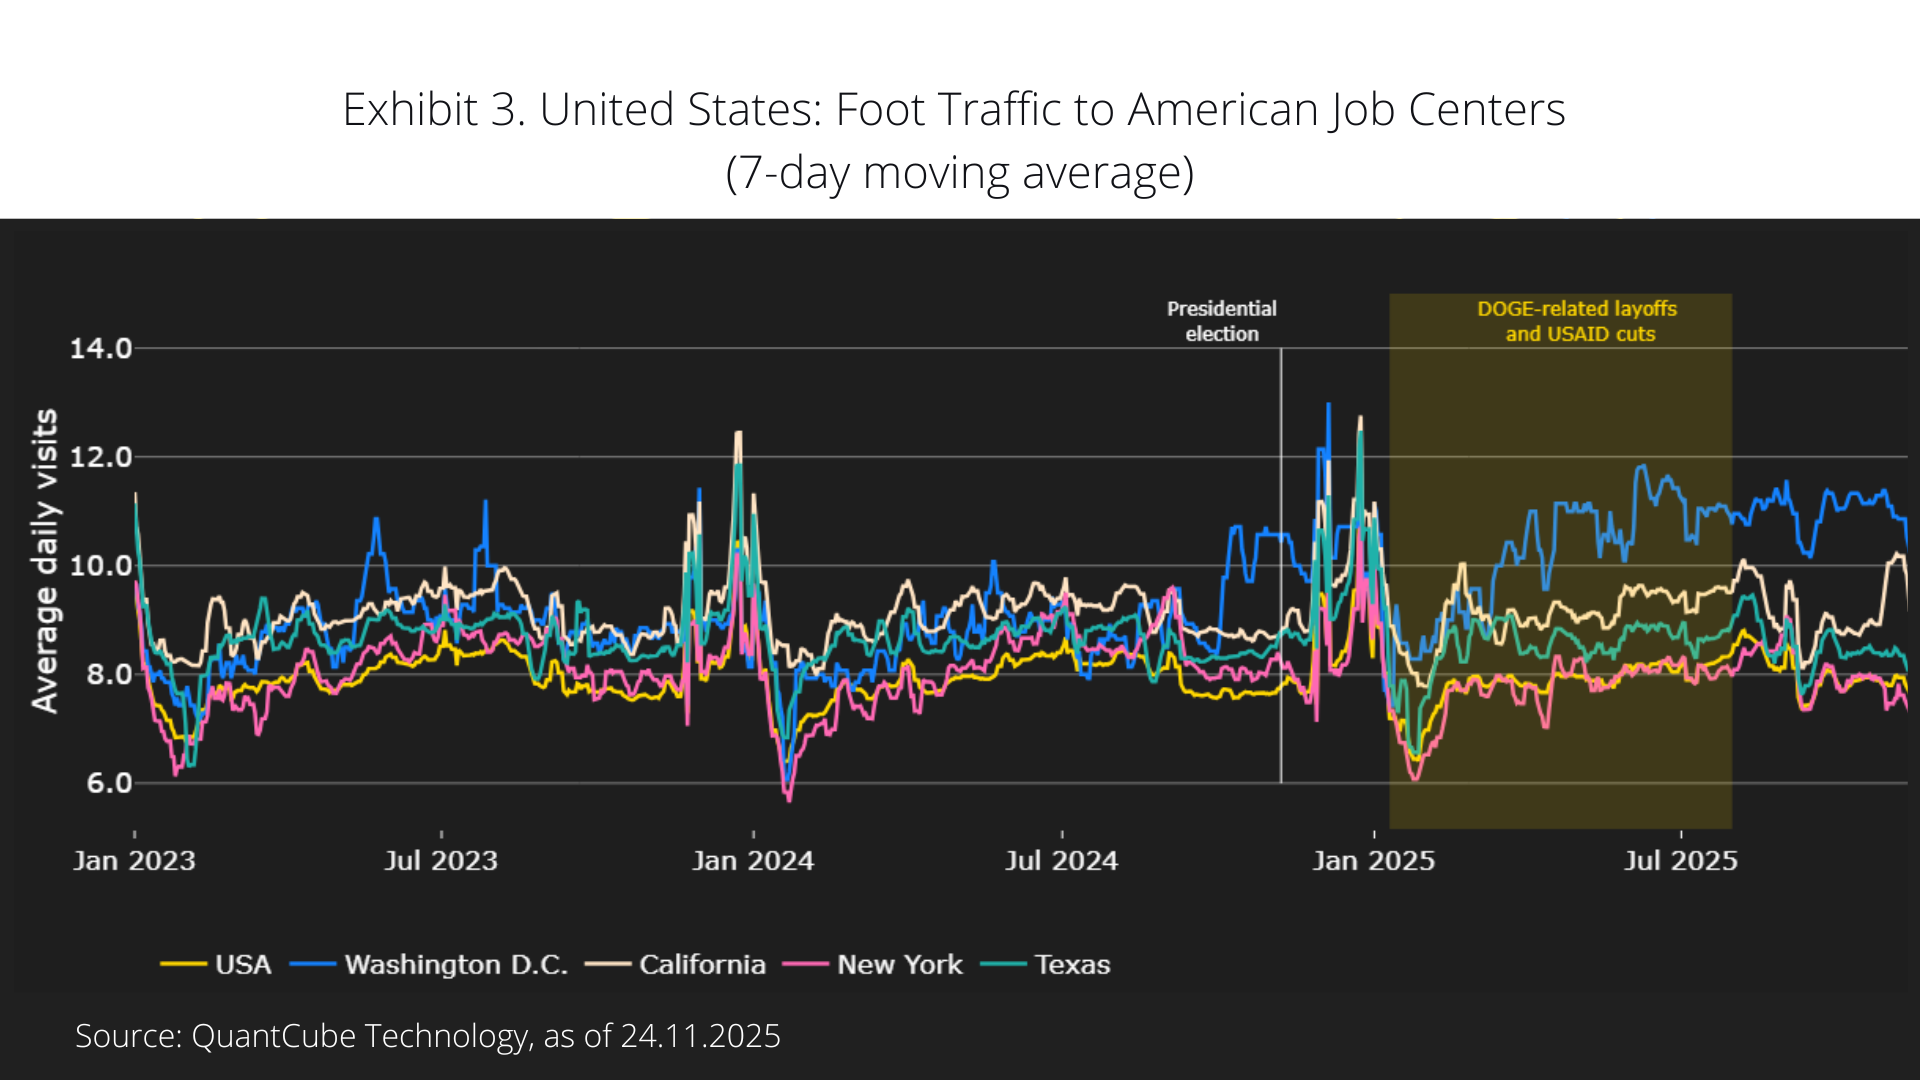
Geographic differences are also becoming more pronounced (Exhibit 3). Washington D.C. has experienced a sharp increase in visits, consistent with adjustments across federal agencies, NGOs and government-adjacent organisations. California shows a noticeable increase as well, likely reflecting sector-specific caution in technology and public services. By contrast, New York and Texas display little comparable movement, underscoring the influence of regional economic structures and local business cycles.
Interpreting the Drivers
Three main dynamics likely explain the rise in job-search activity:
1. Cooling labour demand.
The steady increase in foot traffic to employment-service locations is broadly consistent with other alternative signals including WARN notices, which point to a gradual cyclical slowdown. Since early 2025, investors have increasingly priced in this softer hiring environment, interpreting successive confidence shocks as a sign that firms are becoming more cautious. The emerging alignment across high-frequency signals suggests that labour demand is easing, even if headline layoffs remain modest.
2. Sectoral and technological reallocation.
The acceleration of AI adoption is reshaping work processes, generating productivity gains but also prompting restructuring and reskilling needs. These transitions often lead to increased use of private employment agencies, even when job losses are limited. Some of the regional divergence in our data – particularly in states with high concentrations of technology, services, and knowledge-based sectors – could reflect these reallocation effects, although they warrant further investigation.
3. Rising financial stress.
Households appear to be under growing pressure. Discretionary retail footfall has declined steadily since the summer, and the gap has widened in recent weeks, as shown in Exhibit 4. This decline, combined with rising credit-card delinquencies, supports the interpretation that more households may be seeking supplementary income or more stable employment, contributing to the rise in job-search activity.

What This Means for the Fed
In the absence of official NFP data, the Fed is likely to place greater emphasis on real-time evidence to assess labour-market conditions. The signals from our indicators point to a labour market that is softer than in 2024, with clearly identifiable pockets of weakness, but not one experiencing the kind of sharp deterioration typically associated with a downturn. Job losses remain concentrated in specific geographies and sectors, while the broader cooling is taking place through reduced hiring, higher search intensity, and increasing household financial stress rather than widespread layoffs.
This nuanced picture reinforces the FOMC’s cautious, wait-and-see stance. Labour market momentum is slowing but not collapsing; inflation uncertainty remains elevated; and the cost of mis-signalling policy during a data blackout is unusually high.
Until the statistical pipeline reopens in mid-December, high-frequency behavioural indicators will remain essential for navigating an otherwise opaque policy landscape.