
QuantCube Commodity Intelligence: Navigating uncertainties in the wheat market

Commodity Intelligence
QuantCube’s new insights into the wheat market and food security
The global wheat market is currently facing a two-fold crisis. In particular, the increased drought risks around the world are posing acute challenges to global wheat production. Meanwhile, the ongoing war in Ukraine has been disrupting wheat supply chains and continues to fuel geopolitical uncertainties. Understanding the dynamics of the often-volatile wheat market is challenging without robust real-time observations. In particular, the insights from time-lagged official data can be misleading. Using our cutting-edge real-time indicators, which are based on our proprietary technology for satellite data and textual analytics, we evaluated the wheat market outlook and potential risks associated with food security.
Alarming signs emerging - water stress and wheat production in the US
Since it is highly sensitive to water stress, wheat is vulnerable to the drought, especially its effects on soil moisture. The lack of adequate rainfall and extreme heat during critical growth stages can hamper the development of wheat plants, leading to reduced yields and poor quality of harvested grain.
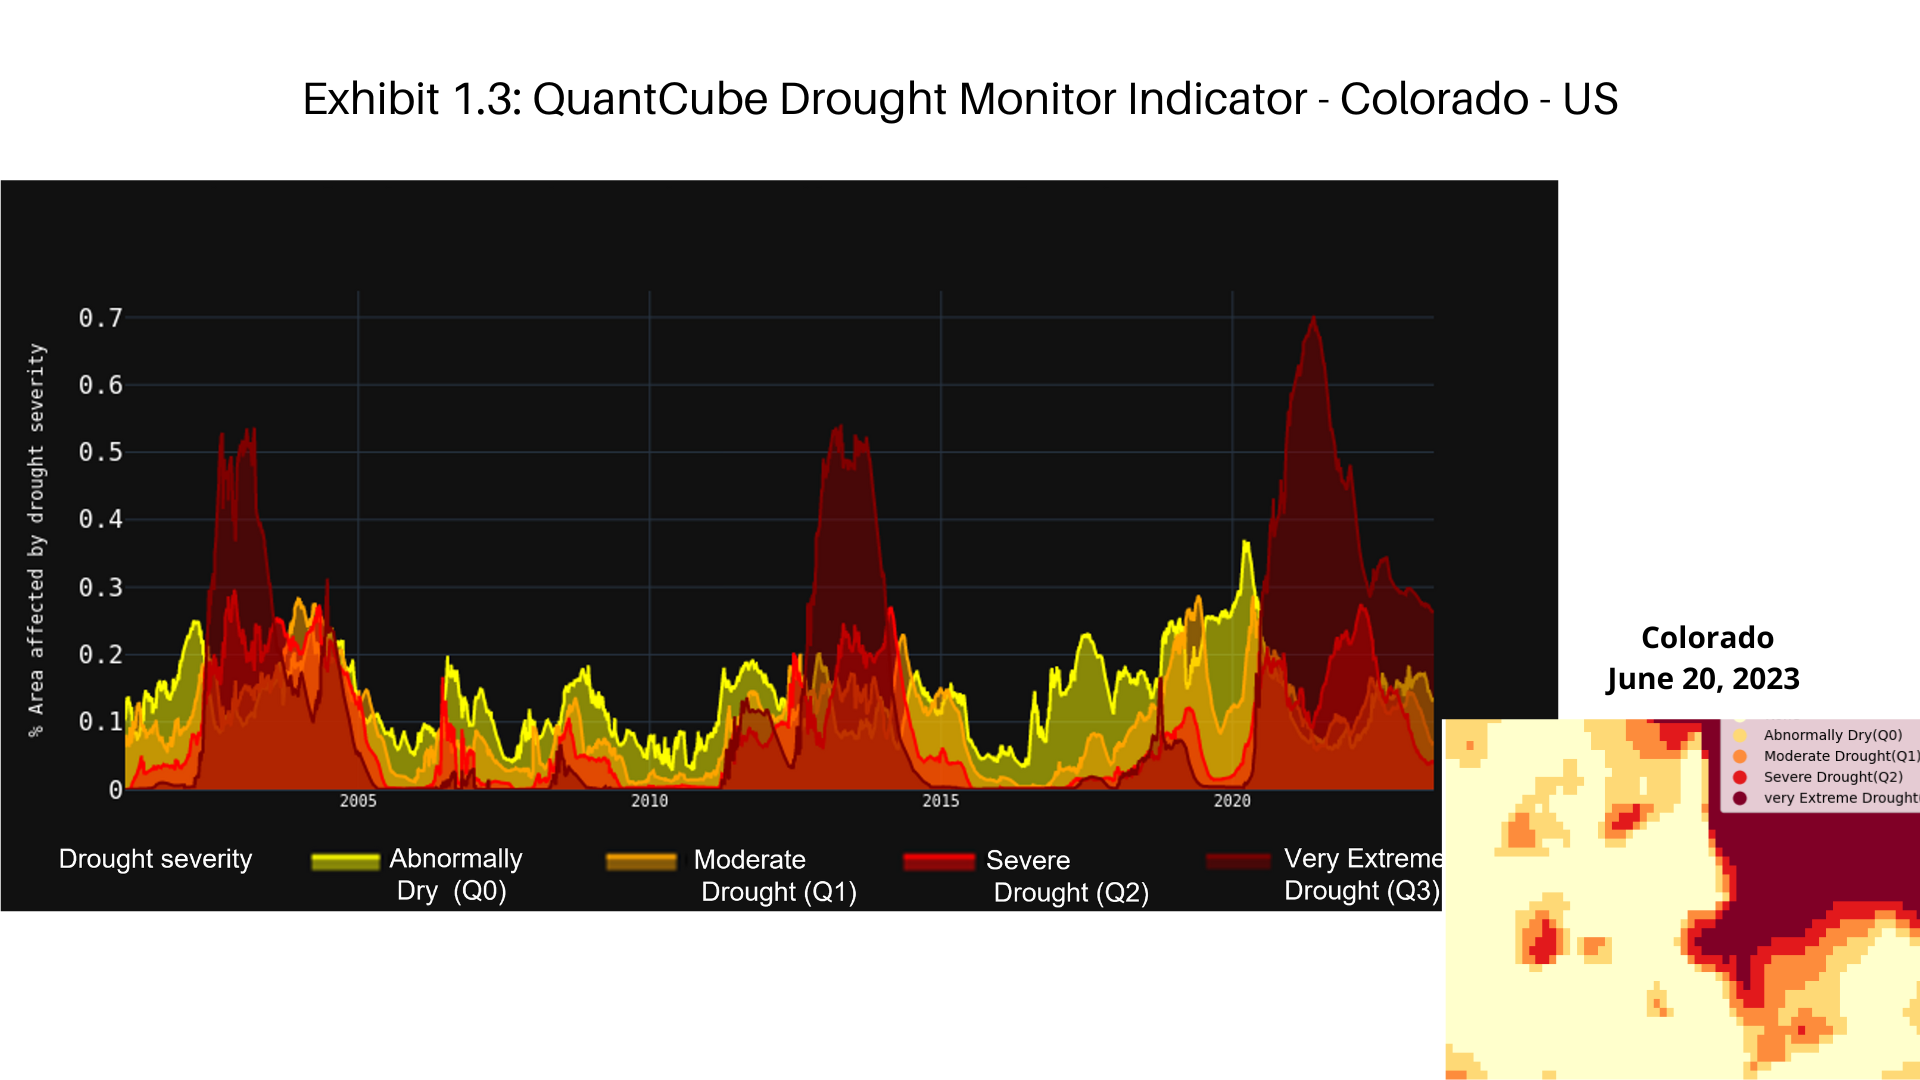
The QuantCube Drought Monitor Indicator monitors the latest drought conditions affecting wheat producing regions around the world. Leveraging satellite-meteorological data on rainfall and temperatures, the indicator examines the drought conditions daily on a regional and national level. Drought severity is then scored with a range between Q0 (the least severe) and Q3 (the most severe) according to the size of the relevant area.
Exhibit 1 shows the evolution of the QuantCube Drought Monitor Indicator from 2000 to the present for the key wheat producing regions in the US; Colorado, Kansas, Montana and Nebraska. The graph and the heatmap represent drought severity in these key states. Our observation portrays the alarming drought conditions that are affecting Hard Red Winter and spring wheat crops. For example, the exceptional drought conditions are affecting over 30% of the land area in Colorado. As for Kansas and Nebraska, two crucial states for US Hard Red Winter Wheat production, the situation is much worse, as 75% of the land area in these states is suffering from extreme drought. In addition, Montana, another state known for its production of Hard Red Spring wheat, has also been grappling with dry conditions throughout much of 2023. Similar drought conditions were experienced in 2012, which caused over US$ 28 billion in agricultural losses in the US. The current levels of drought came after a difficult season in 2022, where scarce rainfall and heat waves curbed winter and spring wheat crops to the lowest level since 1970 according to USDA.


Poor weather conditions affecting key agricultural regions globally
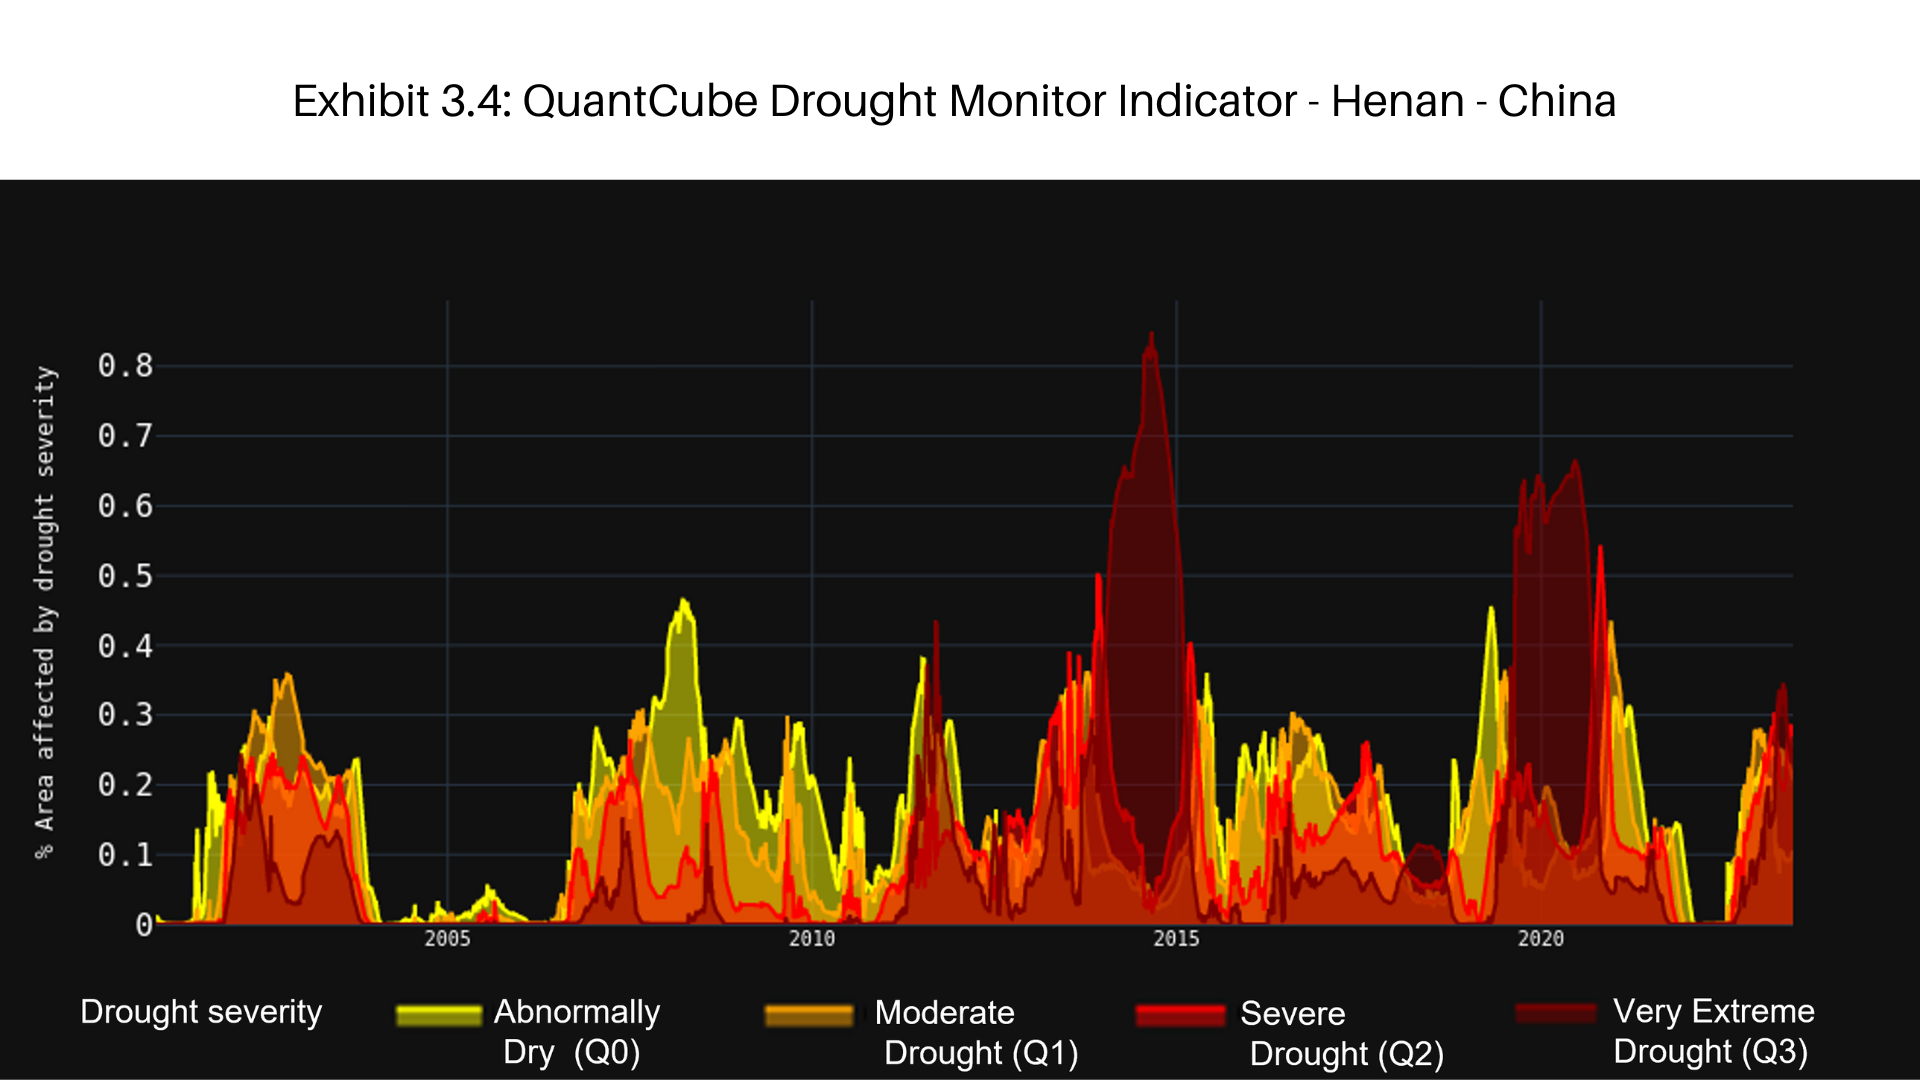
In our observations, severe drought conditions are not limited to the US alone. Exhibits 2 and 3 show the trend of QuantCube Drought Monitor Indicator for key breadbasket regions in the major wheat producing and exporting countries; Russia and China.
Russia is renowned as the largest global wheat exporter. However, it seems that Russia is experiencing continuous drought conditions in its key breadbasket regions, including North Caucasus and Urals. These regions have been suffering prolonged water stress conditions in recent years, which have significantly impacted recent wheat production and supply. Unfortunately, the latest data from the QuantCube Drought Monitor Indicator suggests no improvement this year, as Exhibit 2 demonstrates.


What about the situation in China? China is the largest producer and consumer of wheat in the world. It seems that the country’s wheat security is also facing a significant challenge this summer. As Exhibit 3 shows, the regions of Gansu, Jiangsu, Anhui and Henan have recently suffered persistent dry weather. In Exhibit 4, the insights derived from the QuantCube Rainfall Monitor Indicator (a component of our Drought Monitor Indicator) show high precipitation in recent weeks in the regions of Henan and Jiangsu, which account for more than one third of China’s wheat production. The combination of dry weather and sudden heavy rainfall just before the wheat harvest season often leads to severe flooding. This weather condition might compromise the quality of the grain, and therefore increase China’s reliance on imported wheat to meet domestic demand.
In our view the poor weather in the key agricultural regions globally is likely to shrink grain harvests and put a strain on food safety inventories, with a serious potential impact on grain availability around the world.


Detecting wheat futures trading signals with the QuantCube Drought Monitor Indicator
With the QuantCube Drought Monitor Indicator, investors can observe the ever-changing dynamics of drought conditions in real-time and develop effective systematic trading strategies for the instruments traded in the Kansas wheat futures market. Exhibit 5 shows the cumulative returns of the “Hard Red Winter Kansas (HRK) Wheat futures” strategy we simulated over a 23-year period using the signals detected with the QuantCube Drought Monitor Indicator. The simulation is designed to take advantage of the changes in wheat futures prices that are heavily influenced by the drought conditions.
The yellow line represents the cumulative return of the US Kansas futures when drought levels in the US trend positive and outpace average levels in the area. In this scenario, drought is expected to negatively impact harvests, driving wheat futures prices upwards and thus providing a buy signal. On the other hand, the white curve represents the cumulative returns when drought is following a negative path and stands below average seasonal levels, suggesting large grain availability. In this scenario, a short position in the Kansas wheat future is beneficial for alpha generation.
Overall, the drought strategy proves to be a dynamic and responsive tool that allows investors to benefit from the changes in wheat futures prices driven by the sudden shifts in drought conditions.

Navigating Turbulence: QuantCube's Wheat Anxiety Indicator reflects mounting pressure from droughts, geopolitical tensions and export bans
Weather conditions are a key factor to determine wheat production and prices. However, there are other variables to consider when seeking to gain a full outlook on the wheat market. In particular,political decisions, economic trends, weather patterns and geopolitical dynamics can dramatically influence wheat supply and demand, thus affecting wheat price and availability. To track these diverse factors, we developed the QuantCube Wheat Anxiety Indicator to monitor the sentiment towards wheat market outlook. The indicator leverages QuantCube’s sophisticated NLP (Natural Language Processing) algorithms and analyses hundreds of multilingual wheat-relevant articles related to the key wheat exporting countries including US, India, China and Russia. It is designed to provide early insights into public sentiment surrounding events and developments related to global food markets. The indicator ranges from 0 (the lowest anxiety) to 1 (the highest anxiety) based on the level of anxiety detected. Exhibits 6, 7, 8 and 9 represent the evolution of the QuantCube Wheat Anxiety Indicator since 2016 for the US, Russia, India and China. Since its inception, the indicator has been capturing wheat-related events effectively to provide warning signals before the volatility in wheat production, supplies and prices manifest. Wheat anxiety in all the countries we track started to rise in late January 2022 and provided early signals for possible disruptions in wheat supplies caused by the escalating tensions between Russia and Ukraine. The anxiety level reached a peak on February 24, 2022, when the war started.
A few weeks after India recovered from the Russia-Ukraine war shock, the QuantCube Wheat Anxiety Indicator for the country surged again in April 2022, reflecting the growing concerns over drought that subsequently led to the government’s announcement to ban wheat exports on May 12, 2022 (Exhibit 8).
At the moment the indicator is recording a relatively low level of anxiety in all countries, except for China. Interestingly, wheat anxiety in China has been skyrocketing over the last few weeks as Exhibit 9 shows. According to our news feed, it seems that the main concern over wheat production in China stems from the recent significant rainfall after a prolonged drought period, which occurred just before the harvest season. The severe rainfall has put wheat crops at risk and fuelled public concern for wheat production outlook. As blackening wheat due to rain usually becomes unfit for human consumption, the government mobilised emergency teams with the aim of saving as many crops as possible to protect China’s food security.
QuantCube’s Wheat Anxiety Indicator can be a valuable tool when applied to systematic wheat trading strategies; sudden and significant increases in the anxiety score can serve as early warning signs, often predicting significant disruptions and shifts in the wheat market. These developments have a direct impact on the price and volatility of wheat. Traders who closely monitor this indicator can promptly reassess their wheat positions, gaining a competitive advantage in the market.


In conclusion, the wheat market is currently experiencing growing uncertainty due to multiple factors. Concerns over dry weather conditions, coupled with the potential occurrence of El Niño, are heightening apprehensions over grain supply and future price levels. Moreover, there are ongoing anxieties for Russia's commitments to underwrite the Black Sea Grain Initiative. To navigate this complex landscape, it is critical to gain real-time insights by using robust monitoring tools. As explained above, our indicators such as the QuantCube Drought Monitor Indicator and the QuantCube Wheat Anxiety Indicator, provide users with valuable real-time insights for achieving superior performance in the challenging wheat market.