
A New Inflation Wave: Nowcasting and Systematic Strategies as a Macro Edge

Macro Insights
QuantCube’s latest insights into inflation dynamics and systematic investing
Summary
The persistent closure of the Strait of Hormuz has removed roughly one billion barrels from global oil supply, pushing energy inflation sharply higher across major economies. One-year inflation swaps now price US CPI at around 3.5%, euro area inflation near 4.0%, and UK inflation close to 5.0%. The shock is no longer confined to oil and gas alone. Its transmission is increasingly visible across a broader range of sectors, including rubber, plastics, aluminium, fertilisers, and pharmaceuticals, while the risk of second-round wage effects continues to build.
Near-term inflation expectations will remain heavily driven by geopolitical developments: the prospect of an agreement, the extent to which Hormuz traffic resumes, and the speed at which global supply chains normalise. These are scenario variables rather than short-term signals. Within each scenario, however, high-frequency data becomes essential for tracking how the shock is feeding through into prices – and for positioning ahead of official releases.
A Daily, Point-in-Time Inflation Signal
QuantCube produces inflation nowcasts for 14 economies, including the US, euro area and its four largest member states, the UK, Japan, China, Canada, Australia, and Brazil. The methodology is built around three structural principles.
First, the estimates are daily and point-in-time. Each reading reflects where inflation stands on that specific day, rather than projecting where month-end CPI will eventually print. This enables sub-monthly turning points and trend breaks to be identified well before official releases.
Second, this frequency is made possible through alternative data. We systematically target the CPI components that account for the largest share of Inflation variance, then model them using a wide range of high-frequency alternative inputs, processed through statistical and machine learning techniques. The modelling framework itself, however, remains fundamentally transparent: the contribution of each component is explicit, measurable, and economically interpretable.
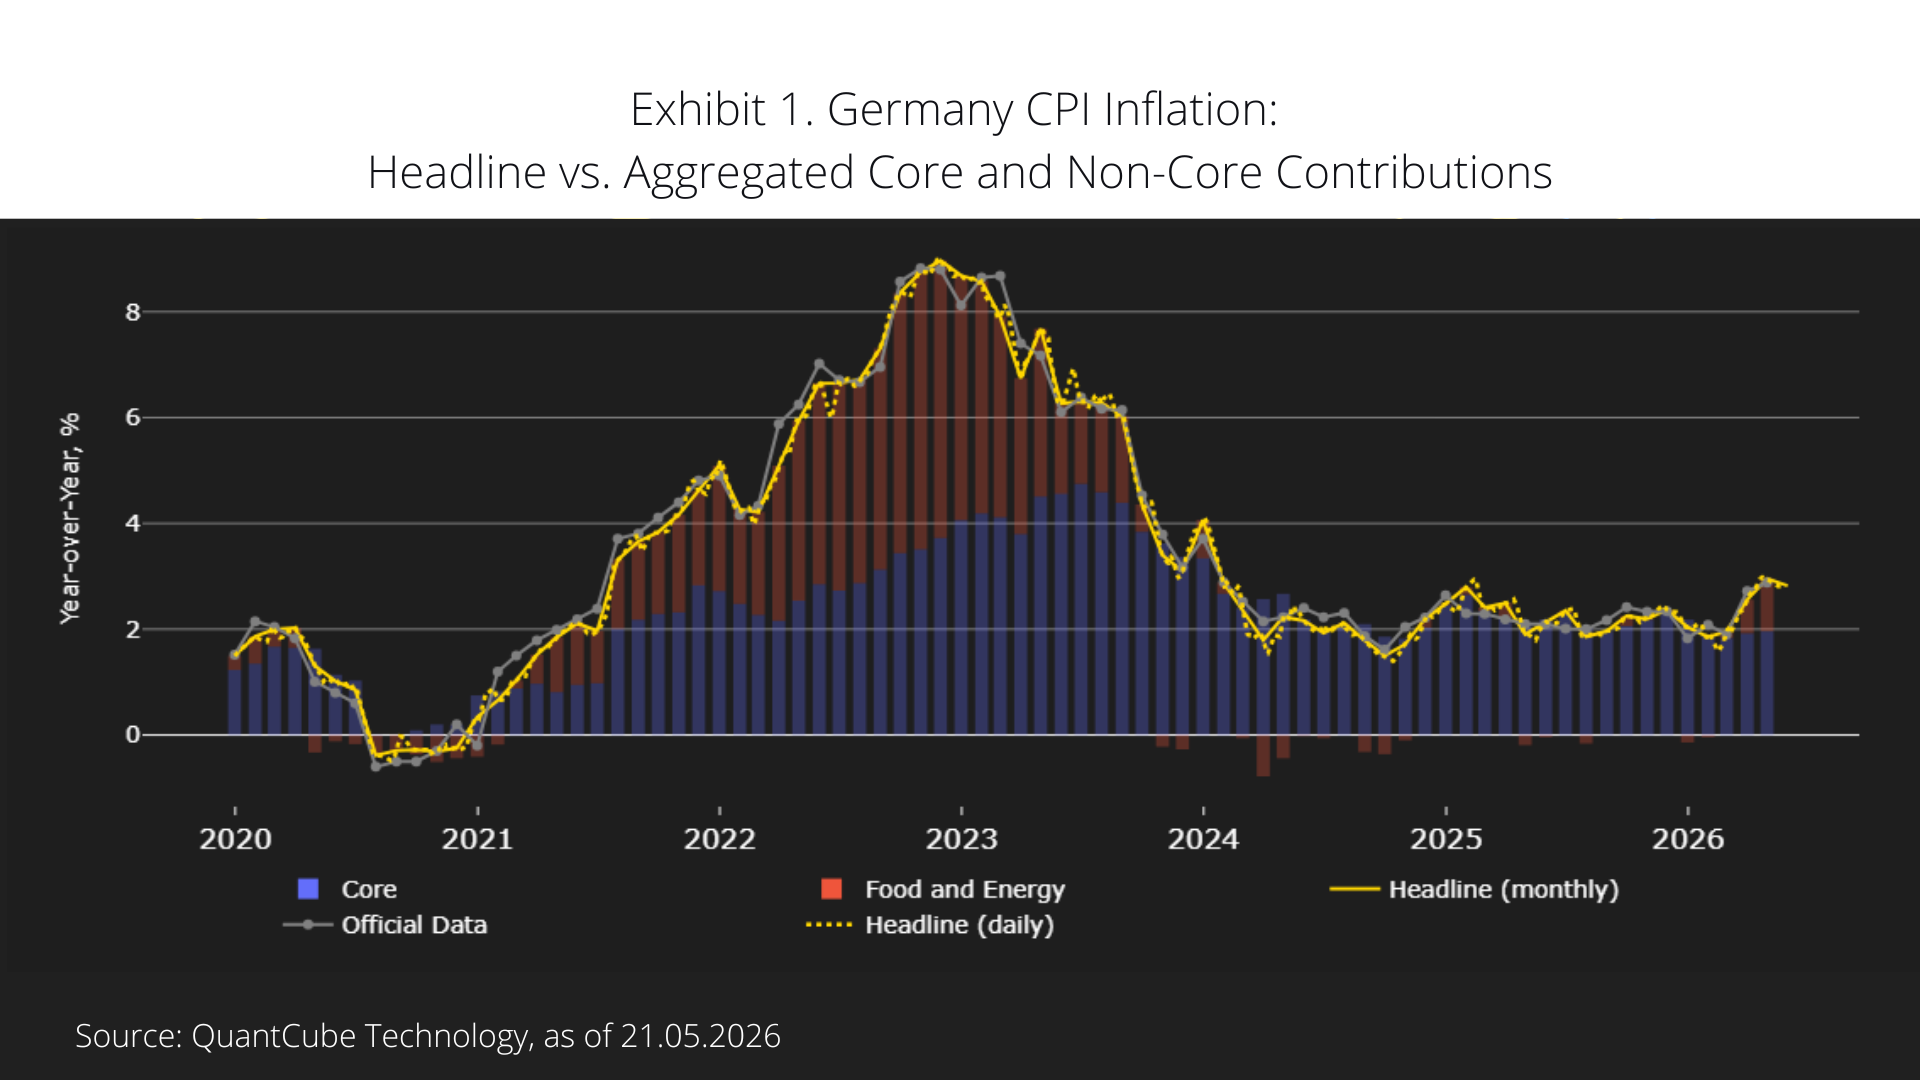
Third, explainability is central to the framework. When a nowcast moves, the shift can be traced back to specific sub-components. This is particularly important during a supply shock, where the transmission mechanism typically runs from energy into goods prices and, potentially, into wages. Our indicators therefore provide a systematic breakdown between core and non-core inflation, alongside the contribution of each component to the aggregate reading.
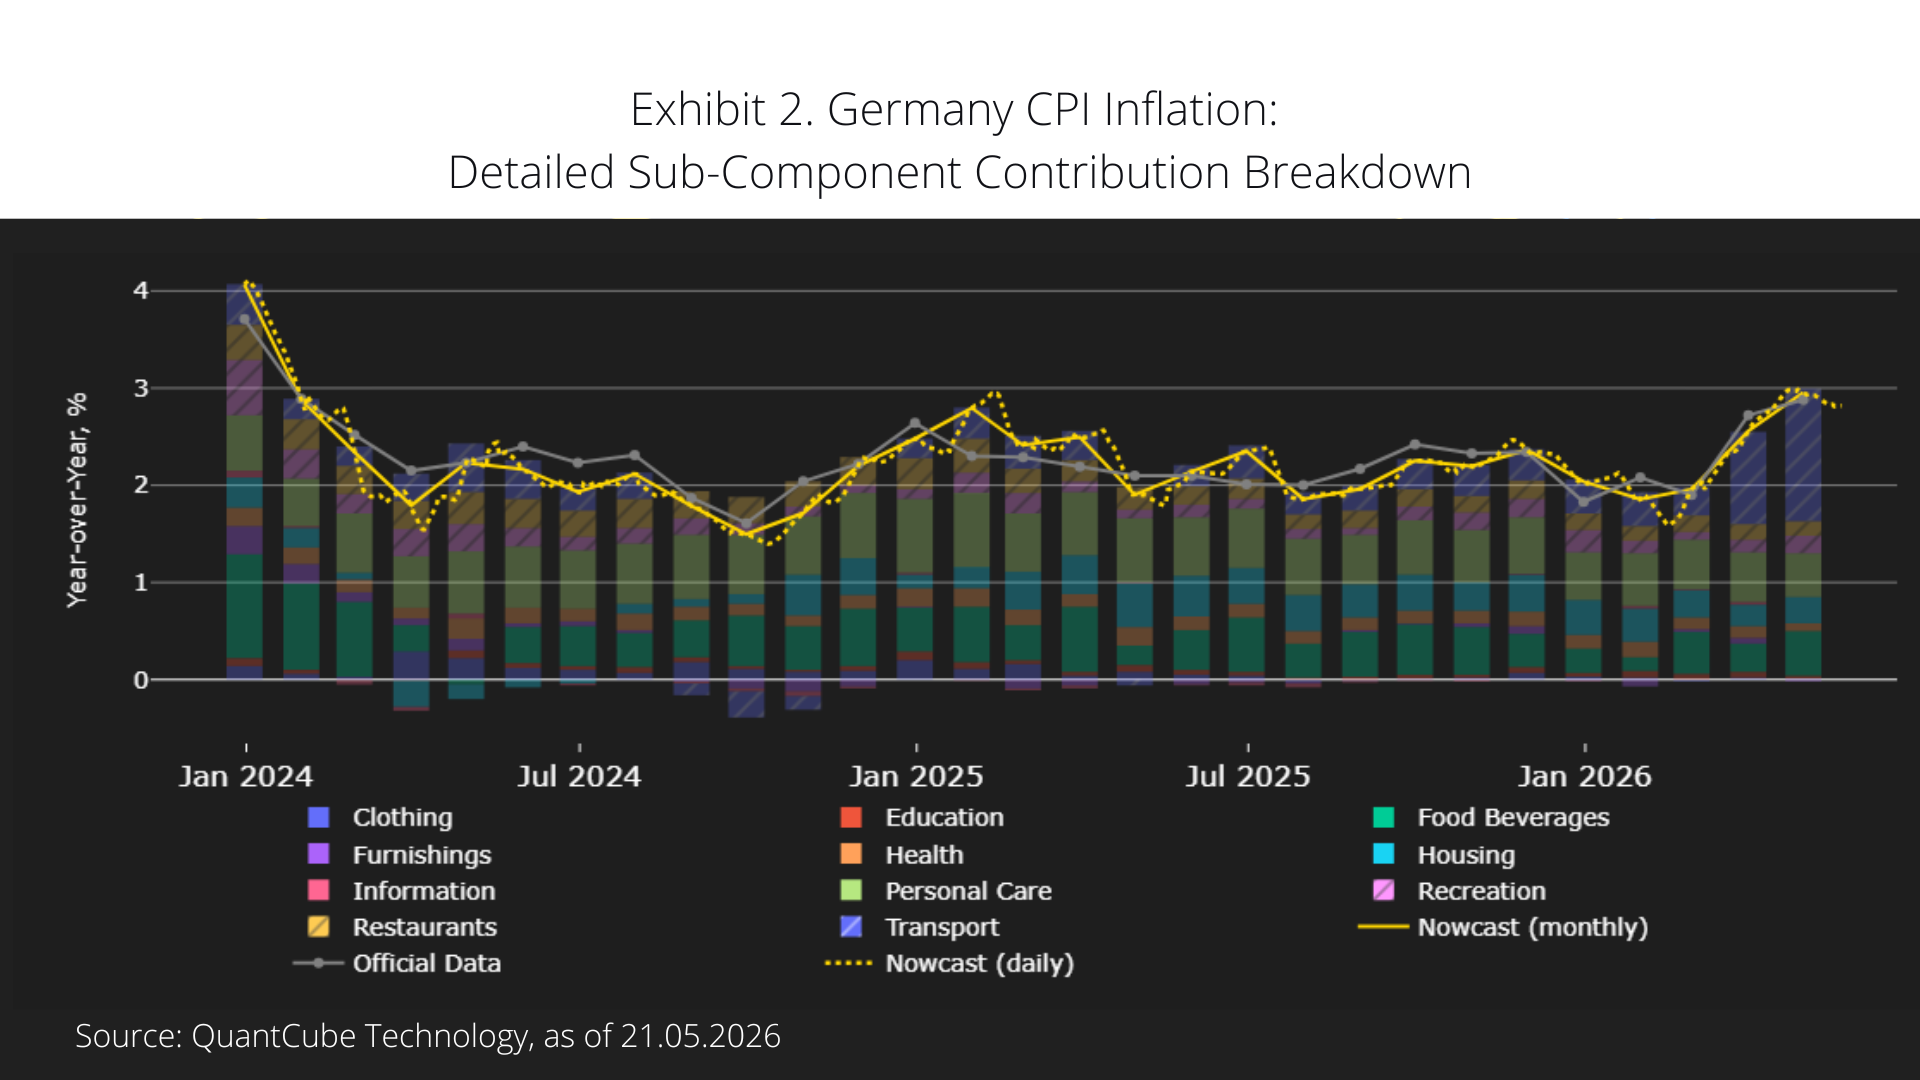
We have recently extended this framework further by introducing a more granular decomposition of inflation sub-components, aligned with the BLS perimeter in the US and the revised COICOP framework in Europe. This provides a more detailed and internationally comparable view of inflation dynamics. In the current environment, it also allows the transmission of the Hormuz shock to be monitored in real time. So far, the move has been driven primarily by energy inflation – and more specifically by transportation-related components, reflecting higher fuel and gasoline prices – as illustrated in Exhibit 1 and 2 for Germany.
Systematic FX Strategies
These inflation nowcasts underpin a suite of systematic FX strategies designed to navigate inflationary macro regimes and their cross-asset spillovers. In the current geopolitical environment, two approaches have been particularly effective.
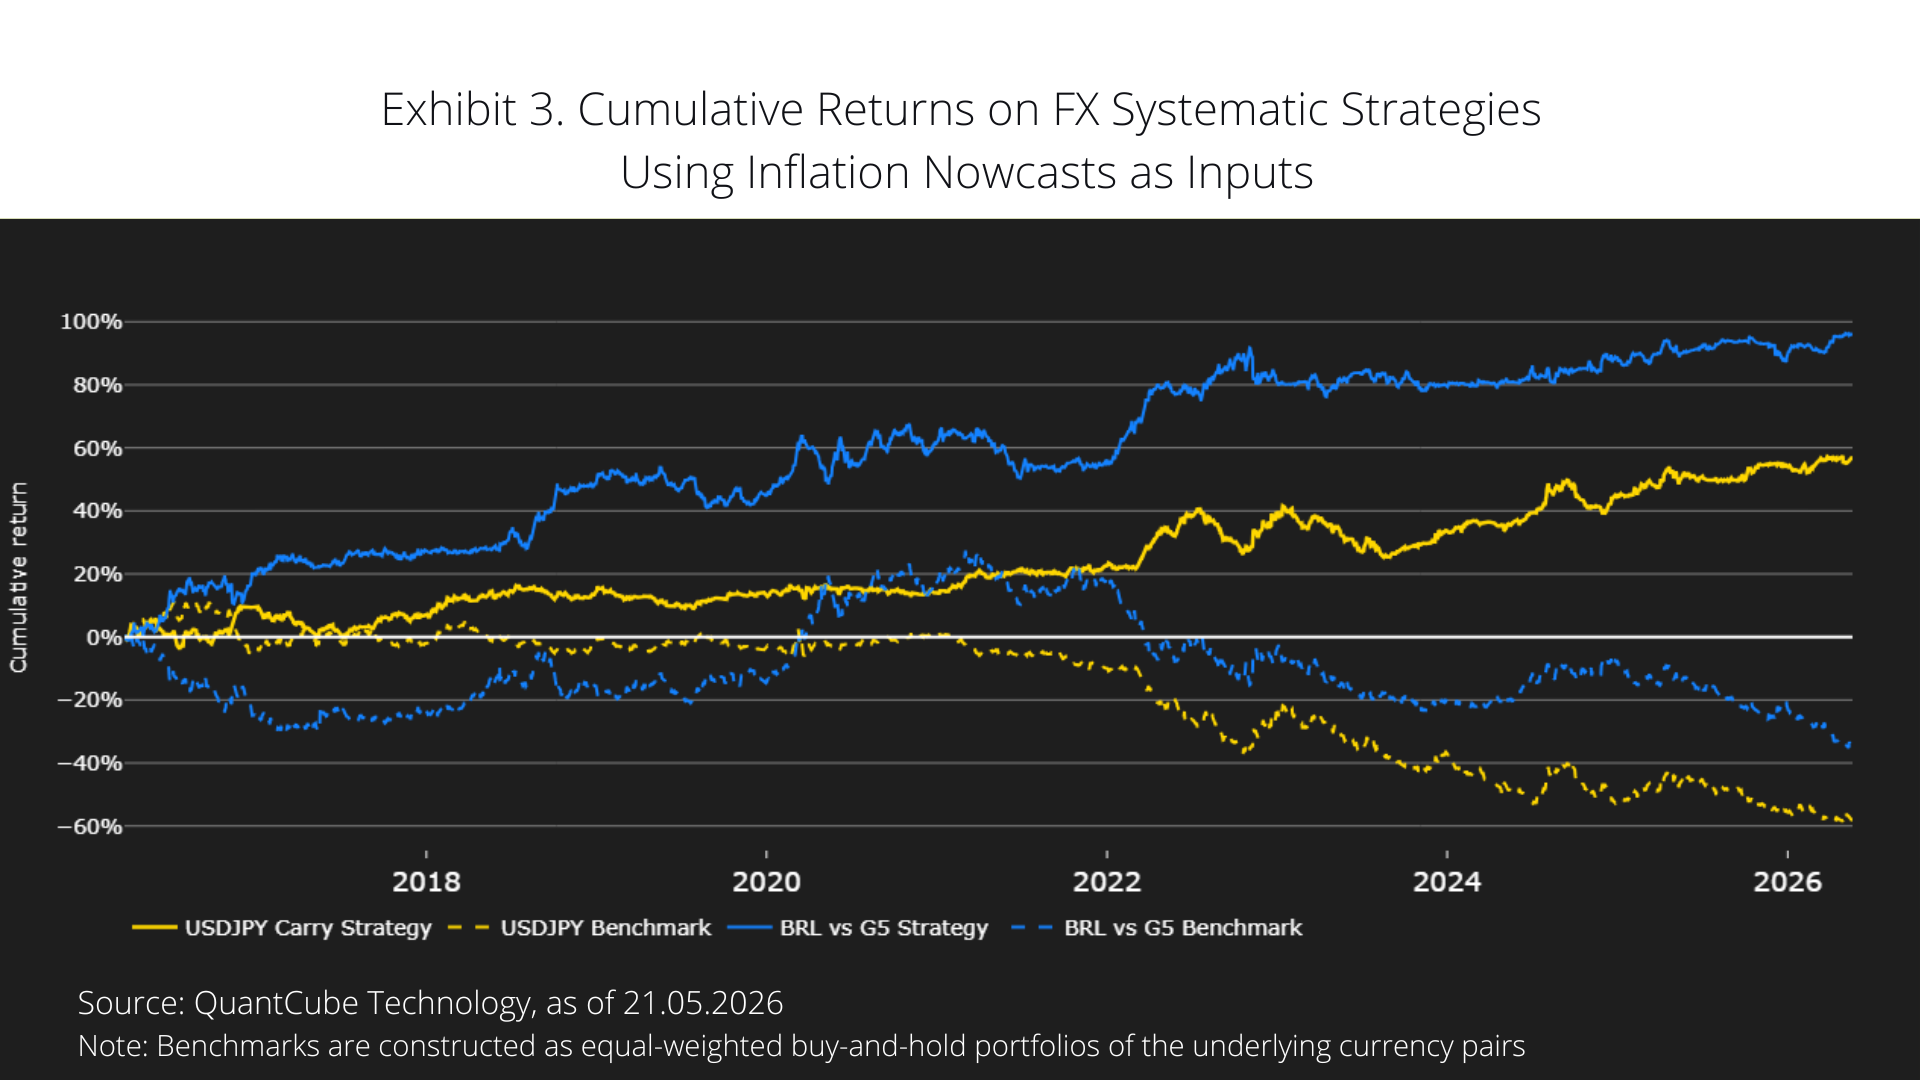
The first focuses on inflation risk with a focus on emerging markets, where accelerating CPI tends to compress real rates and reprice inflation premia – typically a negative signal for the currency. One example is our BRL-centred model, which captures this dynamic by comparing Brazilian inflation momentum against that of G5 economies. When Brazilian inflation accelerates more rapidly than its counterparts, the model generates directional signals against the BRL across the EURBRL, GBPBRL, JPYBRL, CADBRL, and AUDBRL.
The second approach consists of standalone strategies combining carry and inflation momentum. Our USDJPY strategy, for example, is built around the inflation differential between the US and Japan. When US inflation momentum accelerates relative to Japan's, the spread widens in favour of the dollar, reinforcing the pair’s existing carry advantage. Japan's structurally lower inflation regime, combined with the yen's sensitivity to real-rate differentials, makes USDJPY particularly well suited to this framework. Beyond directional positioning, these strategies can also function as effective macro hedges in inflationary environments, providing a systematic mechanism to offset inflation-driven currency exposure within broader portfolios.
Since the closure of Hormuz and the subsequent repricing of global inflation expectations, both strategies have generated cumulative positive returns, materially outperforming their respective benchmarks (Exhibit 3).
Refining Precision Without Sacrificing Reactivity
The core strength of a high-frequency nowcast – reactivity and early trend detection – is also the source of its principal limitation: noise. Alternative data designed to lead official releases will naturally exhibit greater short-term volatility, which can reduce accuracy when minimising estimation error becomes the primary objective.
At the same time, demand has increasingly shifted toward level-based applications, such as trading CPI surprises relative to consensus expectations or calibrating inflation exposure against a target path. This has driven two major enhancements to the framework over the past year.
The first is rebasing. Rather than calculating inflation by comparing today’s estimated index with last year’s estimated index, the framework now benchmarks against the prior year’s official index level. This eliminates the effect of historical estimation errors within the year-on-year calculation.
The second is an enhanced euro area model. This combines improved estimates for Germany, France, Italy, and Spain through the rebasing methodology, alongside a new modelling layer covering smaller member states. Together, these improvements have reduced RMSE by 37% for the US indicator and 42% for the euro area over the past 36 months.
Further optimisation remains ongoing, alongside the integration and testing of new alternative data sources, with the objective of continuing to improve performance – especially relative to consensus expectations. Coverage is also expanding, with Switzerland expected to be the next economy added to the framework.
Disclaimer
This website is provided for general informational purposes only and does not purport to be comprehensive or include any representation, warranty, assurance or undertaking. Nothing herein is intended to be advisory or relied upon, nor shall any statement bind QuantCube, its affiliates or successors.
Information provided has not been independently verified and does not constitute an offer or invitation to partake in any transaction, or any sale, purchase or recommendation of any securities or other product or service. Any information contained herein may only be used for your internal use, may not be reproduced or redisseminated in any form, and may not be used as a basis for any financial instruments, products or indices. Nothing herein is intended to provide tax, legal, or investment advice.
This website is provided on an "as is" basis and the recipient assumes the entire risk of any use made of any information contained herein. Historical data and analysis should not be taken as an indication or guarantee of any future performance, forecast or prediction. Market and economic views are subject to change at any time and there can be no assurance that countries, markets or sectors will perform as expected.
Investment involves risks, including market, political, liquidity and currency risks. In no event shall QuantCube or any person involved in the production of this website have any liability whatsoever for any direct, indirect, special, incidental, punitive or consequential damages in relation to the adequacy, accuracy, completeness or reasonableness of this website.