
A New Lens on Activity: Urban Congestion as a High-Frequency Macro Indicator

Macro Insights
Providing early signals on economic activity through urban congestion
Summary
When the Strait of Hormuz closed, the key question for markets was not only the scale of the supply disruption, but how quickly it would feed into real economic activity. To assess this, we rely on high-frequency indicators tracking physical flows, sentiment, and prices.
We now introduce an additional layer: urban congestion. QuantCube’s Urban Traffic Indicator (UTI) provides a real-time measure of mobility, offering a direct read on whether shocks such as Hormuz are translating into changes in daily activity – and, more broadly, into economic behaviour.
Measuring Activity Through Congestion
The UTI proxies economic activity through road congestion. Built from daily image extraction across ~1,800 cities in 142 countries, it measures traffic intensity using colour-coded congestion levels from mapping services. Each observation aggregates the share of road segments by congestion level, adjusted for road network density.
The result is a daily index (0-300), available at both city and national levels. The intuition is straightforward: higher congestion reflects stronger mobility – and, in car-dependent economies, stronger underlying activity.
The Gulf: A Direct Impact
In Gulf economies, where car usage dominates, congestion offers a direct lens on the impact of the Hormuz disruption (Exhibit 1).
In the UAE, our broader dataset had already signalled a slowdown from late February: declining industrial pollution, weaker port activity, softer sentiment, and reduced maritime flows. The UTI confirms this dynamic. Traffic levels dropped sharply from late February, with only a partial recovery into late March.
Seasonality plays a role. Ramadan (February 17 - March 19) typically suppresses mobility through shorter working hours and shifting consumption patterns. However, the data shows a second, distinct break around February 28, coinciding with the onset of the conflict. The magnitude of this decline is comparable to the Ramadan effect itself.
More importantly, the post-Eid rebound failed to restore congestion to pre-Ramadan levels – pointing to a persistent drag from the shock.
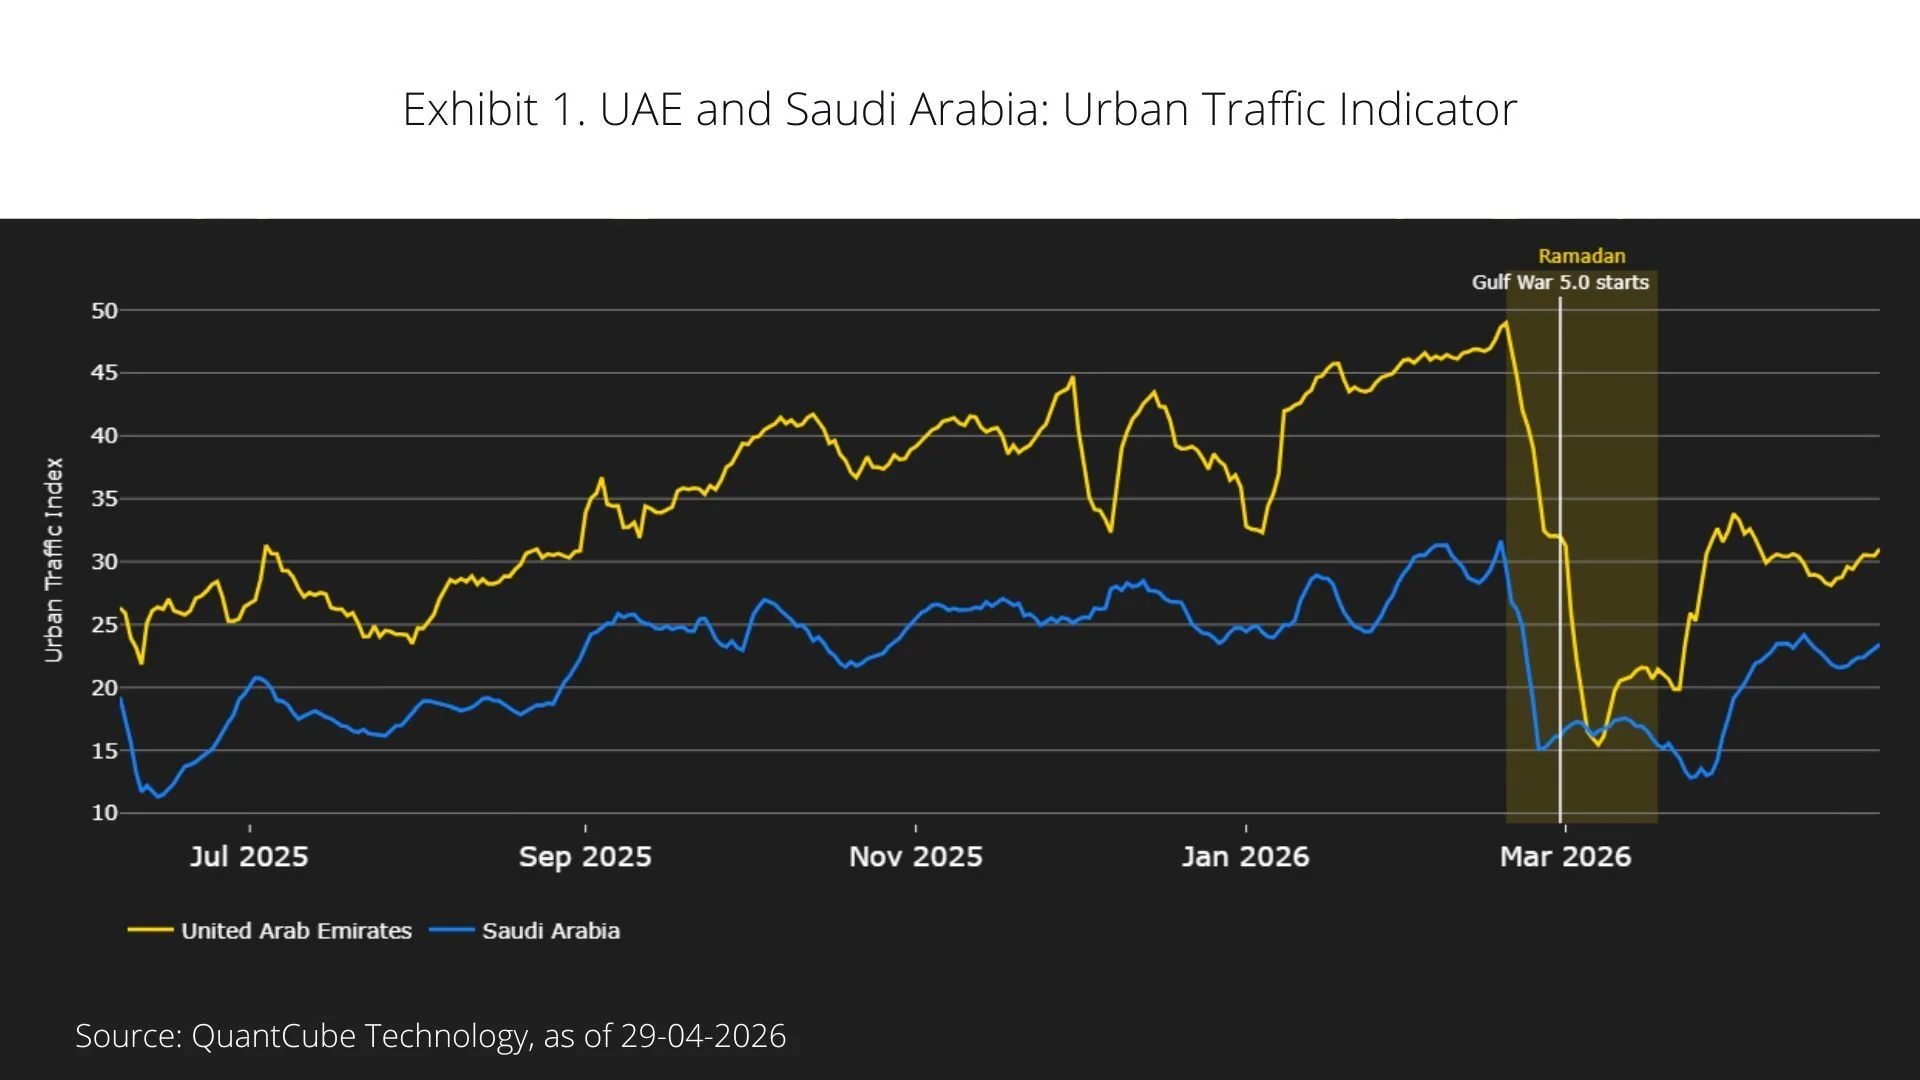
A comparison with Saudi Arabia reinforces this interpretation. While Ramadan effects are similar, the additional decline linked to the conflict is more limited – consistent with lower direct exposure of Saudi urban centres.
Asia: Limited Spillovers – For Now
The broader question is whether the shock is spilling over into energy-importing economies across Asia. We track congestion across China, Japan, Indonesia, Vietnam, Thailand, Malaysia, and Singapore – economies exposed to energy price dynamics and potential supply constraints.
The picture differs across economies. In China (Exhibit 2), congestion has stayed broadly stable despite anecdotal reports of fuel disruptions – likely reflecting buffers such as domestic production and strategic reserves. By contrast, in net importing economies such as Vietnam and Thailand (Exhibit 3), congestion levels have edged lower since late February. That said, holiday-related distortions – Lunar New Year effects in Vietnam and April holidays in Thailand - suggest the signal should be interpreted with caution.


Cross-Checking the Signal
The value of the UTI lies not only in its standalone signal, but in its complementarity with other indicators.
For example, nitrogen dioxide (NO₂) emissions provide a broad proxy for economic activity – capturing industrial output, energy production, and transport. By contrast, congestion isolates the mobility component, independent of vehicle type.
Cross-referencing the two allows for sharper interpretation:
Falling pollution with stable congestion suggests industrial slowdown
Falling congestion points more directly to reduced mobility and consumption
Expanding the Macro Toolkit
Combining congestion data with maritime flows, pollution data, sentiment, prices, and urban mobility offers a more granular view of how shocks propagate through the economy.
For investors, this opens several avenues:
Tracking energy demand through real-time activity, not just prices and inventories
Enhancing growth nowcasts with direct mobility signals
Moving beyond national aggregates to capture local and regional dynamics
Limits and Next Steps
The UTI is still a relatively young indicator, with just over a year of history. This limits back-testing and makes comparisons with past cycles more challenging.
Structural shifts also matter. Lower congestion may reflect behavioural changes - such as remote work or modal shifts - rather than weaker activity. Data consistency varies across countries too, depending on mapping providers and image coverage, which can affect comparability.
Finally, the indicator captures physical mobility only and should be interpreted alongside other high-frequency signals to form a complete macro view.
Disclaimer
This website is provided for general informational purposes only and does not purport to be comprehensive or include any representation, warranty, assurance or undertaking. Nothing herein is intended to be advisory or relied upon, nor shall any statement bind QuantCube, its affiliates or successors.
Information provided has not been independently verified and does not constitute an offer or invitation to partake in any transaction, or any sale, purchase or recommendation of any securities or other product or service. Any information contained herein may only be used for your internal use, may not be reproduced or redisseminated in any form, and may not be used as a basis for any financial instruments, products or indices. Nothing herein is intended to provide tax, legal, or investment advice.
This website is provided on an "as is" basis and the recipient assumes the entire risk of any use made of any information contained herein. Historical data and analysis should not be taken as an indication or guarantee of any future performance, forecast or prediction. Market and economic views are subject to change at any time and there can be no assurance that countries, markets or sectors will perform as expected.
Investment involves risks, including market, political, liquidity and currency risks. In no event shall QuantCube or any person involved in the production of this website have any liability whatsoever for any direct, indirect, special, incidental, punitive or consequential damages in relation to the adequacy, accuracy, completeness or reasonableness of this website.