
Maritime Intelligence: Turning Vessel Data into Macro Insight – The Hormuz Shock

Macro Insights
Real-time insights into Gulf maritime activity and global energy flows
Summary
The outbreak of a new Gulf conflict on February 28 – and the subsequent closure of the Strait of Hormuz – has once again exposed a structural vulnerability in traditional macro analysis: the lag between real-world disruptions and their reflection in official data. For markets, however, the impact is immediate. The Strait of Hormuz accounts for roughly one-fifth of global oil flows. Any disruption feeds rapidly into commodity prices, inflation expectations, and central bank pricing – well before it appears in trade statistics or national accounts. In this context, real-time visibility is not just valuable – it is decisive. This is where high-frequency maritime data provides a critical edge.
From Vessels to Variables: Building a Real-Time Trade Signal
QuantCube’s maritime intelligence framework combines two core data layers:
AIS (Automatic Identification System) vessel data
A proprietary network of geofenced maritime zones (ports, straits, anchorage areas, and key transit routes)
AIS data provides continuous, near real-time information on vessel identity, type, capacity, position, speed, and navigation status. Combined with geospatial mapping, this enables precise monitoring of maritime flows and congestion dynamics – capturing:
Tanker volumes and deadweight tonnage
Anchoring behaviour and idle time
Estimated load factors based on vessel draft
Beyond simple tracking, this approach allows for a granular decomposition of global trade flows by vessel type – oil tankers, LNG carriers, bulk carriers, and container ships – offering a detailed view of how different segments respond to disruption. The result is a set of daily, high-frequency time series across key maritime chokepoints – effectively transforming shipping activity into actionable macro indicators.
A Sudden Stop in Energy Flows – and the Congestion Paradox
Following the initial strikes, our indicators captured an immediate and significant disruption in Gulf maritime flows, with millions of deadweight tons of oil tankers immobilised across monitored areas.
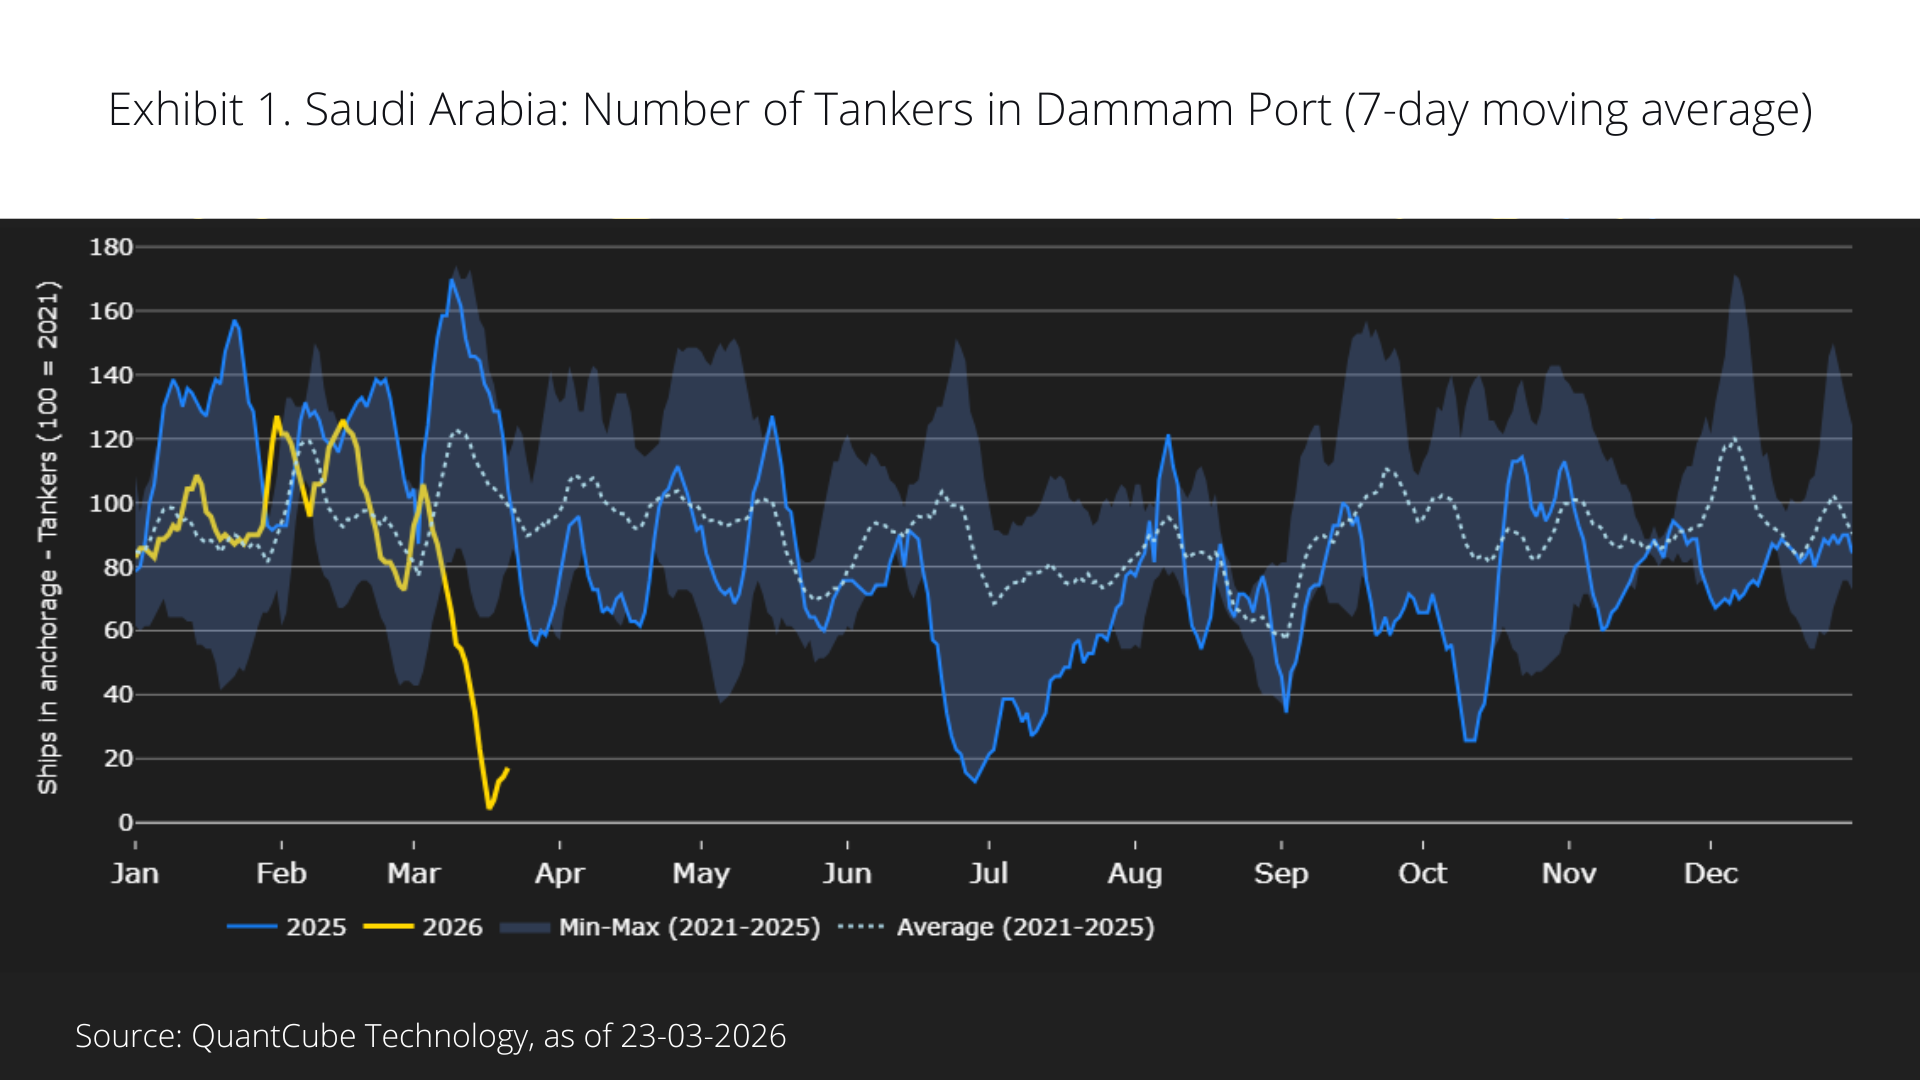
One of the more counterintuitive findings is that the halt in traffic did not lead to increased port congestion. On the contrary, congestion declined across several Gulf ports, as illustrated in Exhibit 1 for the Dammam area in Saudi Arabia.
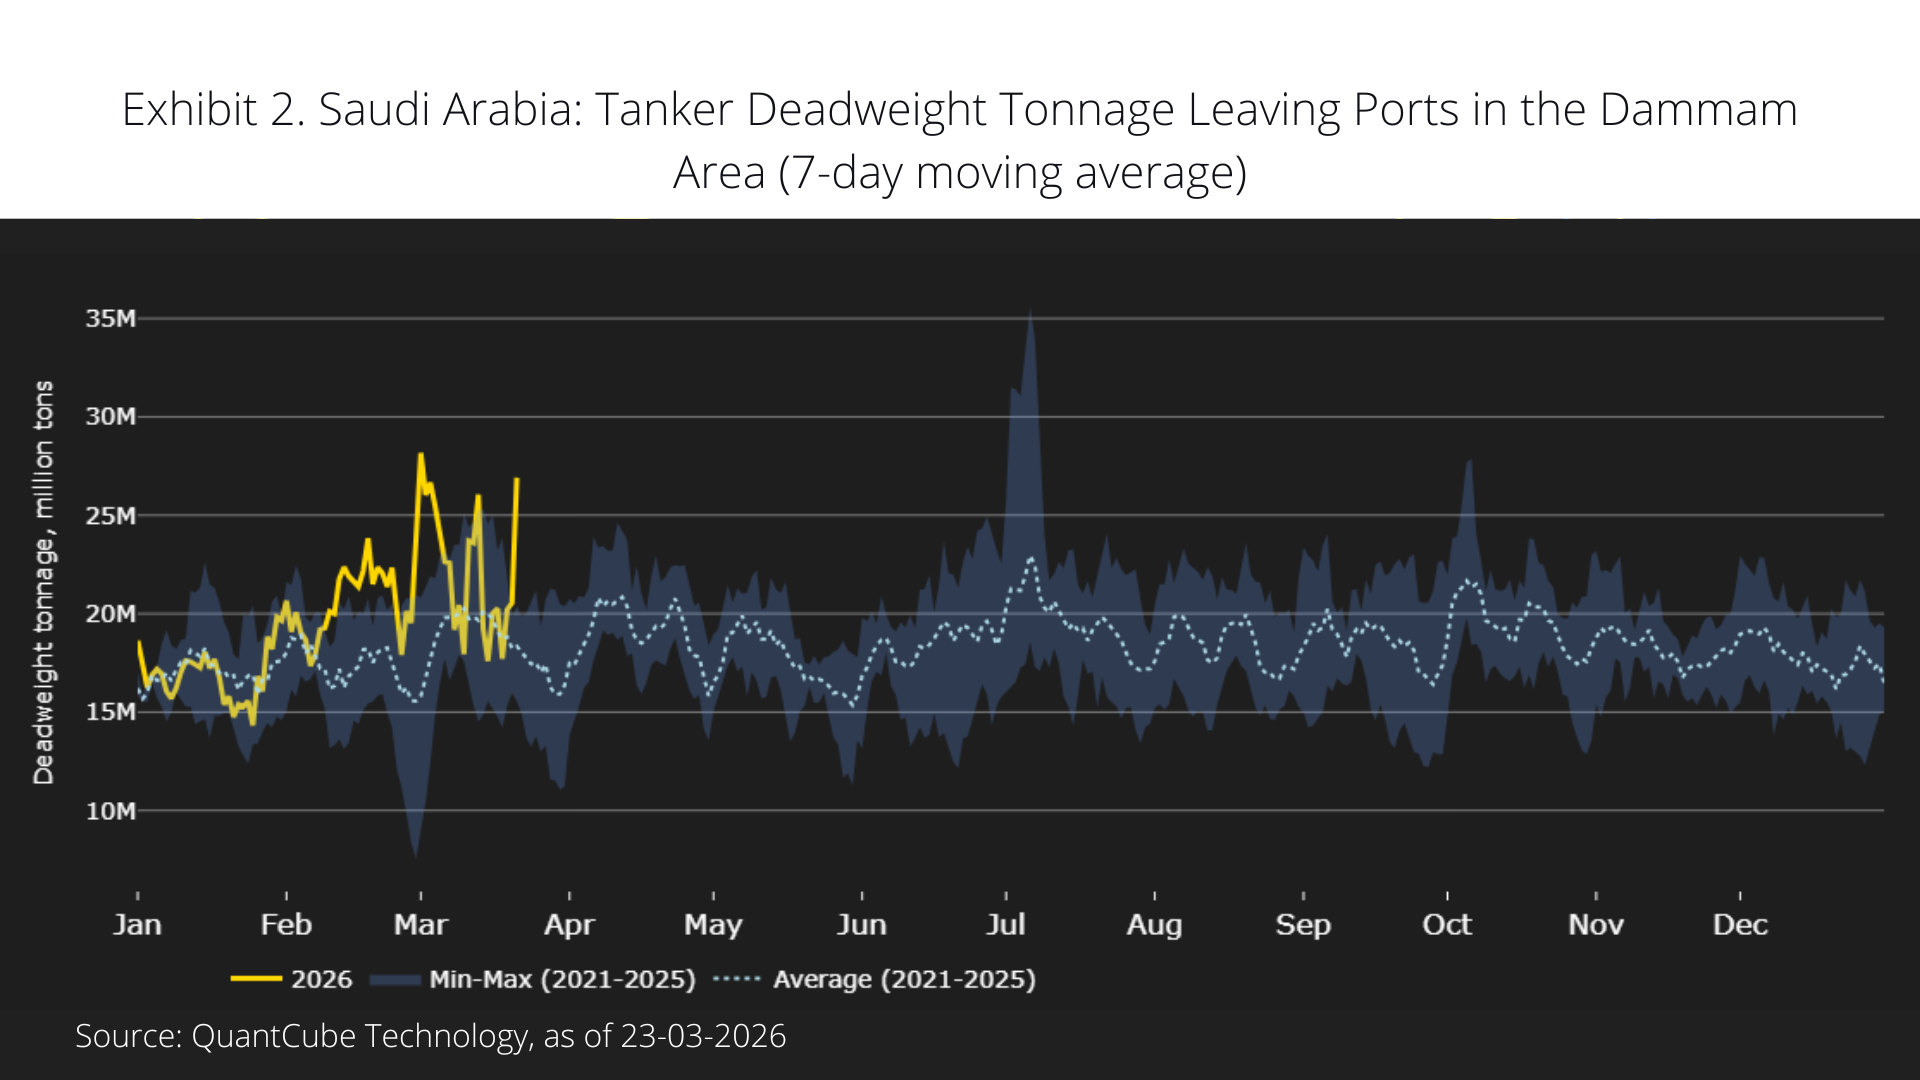
With onshore oil storage capacity rapidly constrained, vessels effectively became floating storage units. Loading activity accelerated in the early phase of the shock, but rather than queue at ports, tankers moved offshore – anchoring at distance while awaiting clarity. This dynamic is clearly captured in the sharp increase in deadweight tonnage exiting monitored port zones in Dammam region, as shown in Exhibit 2.
Rewiring Supply Chains
As the disruption persisted, our data began to capture a second-order effect: the reorganisation of export routes.
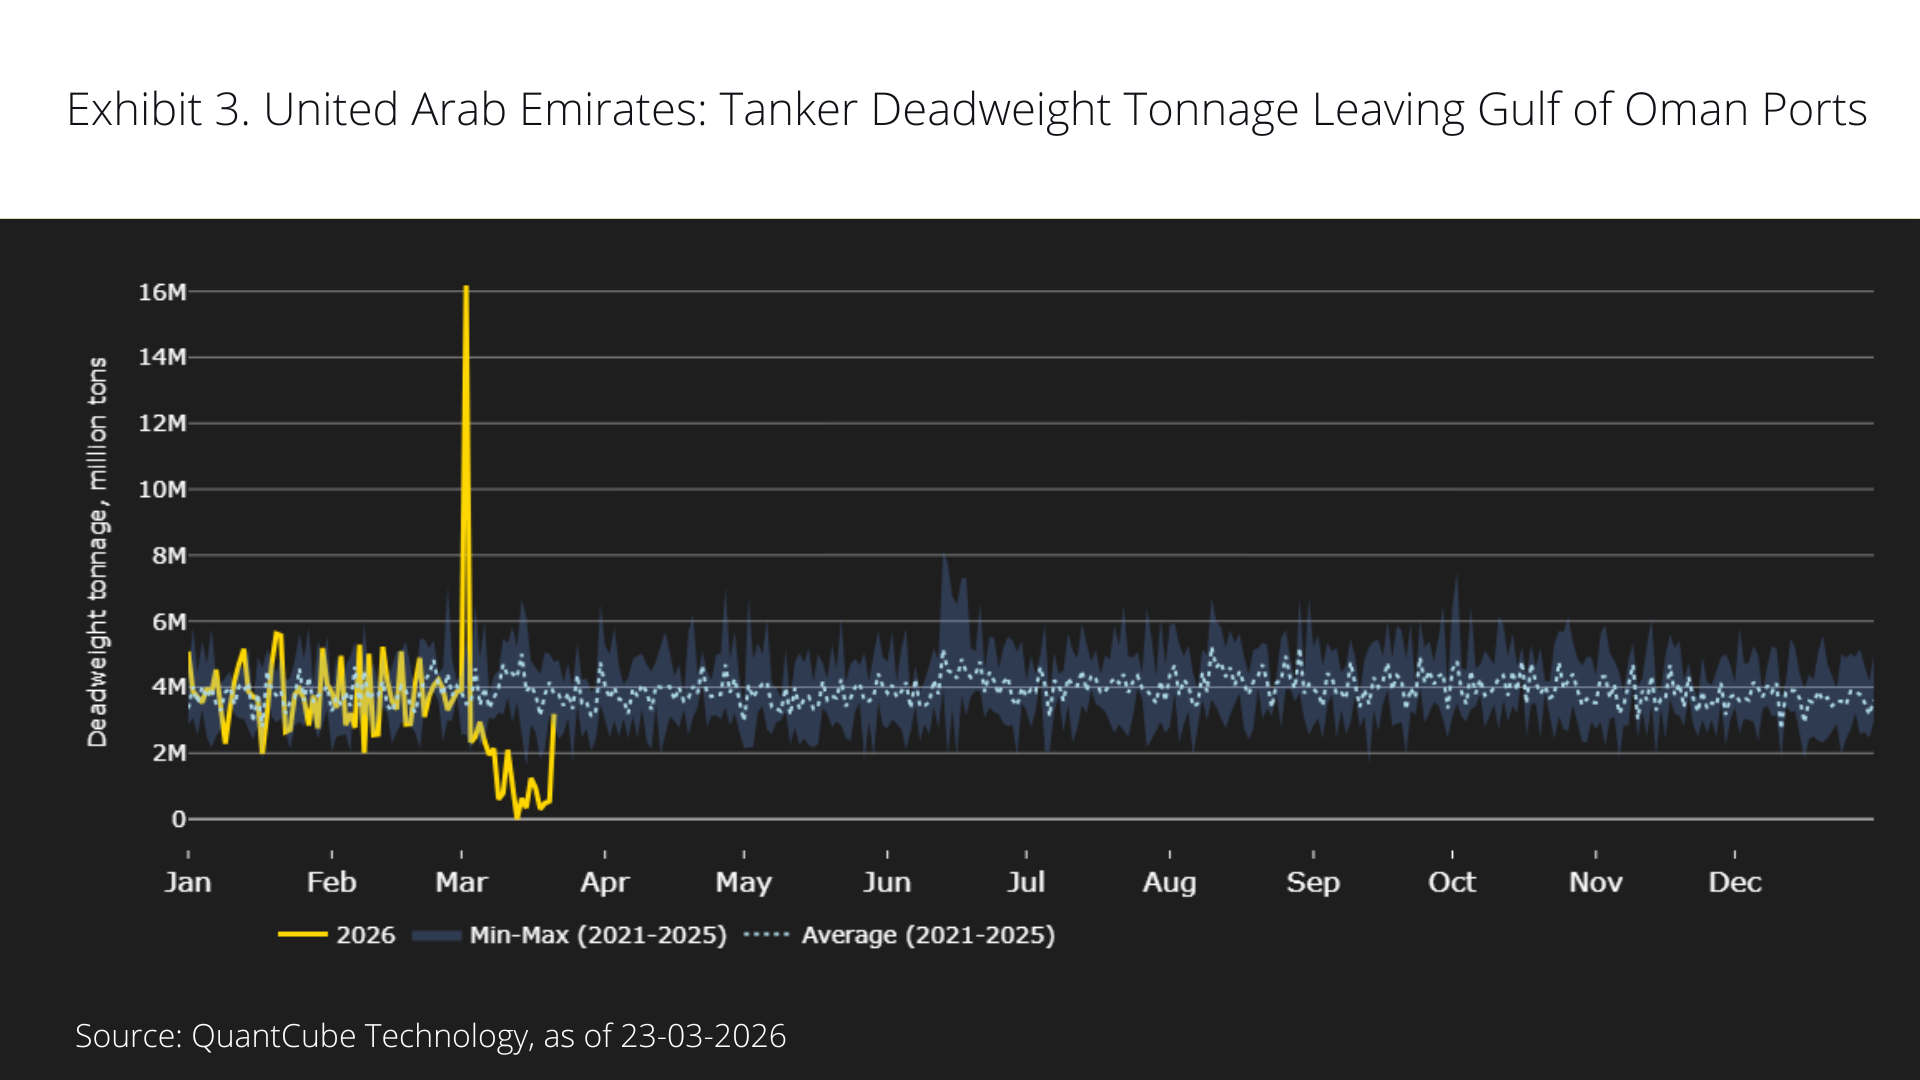
The UAE’s Fujairah terminal – strategically located outside the Strait – initially absorbed part of the redirected flows, reflected in a sharp increase in anchored tonnage (Exhibit 3). However, subsequent strikes on infrastructure triggered a rapid decline in activity, pushing volumes below historical norms. This highlights a critical constraint: while alternative routes provide short-term relief, they remain exposed to geopolitical and infrastructure fragility.
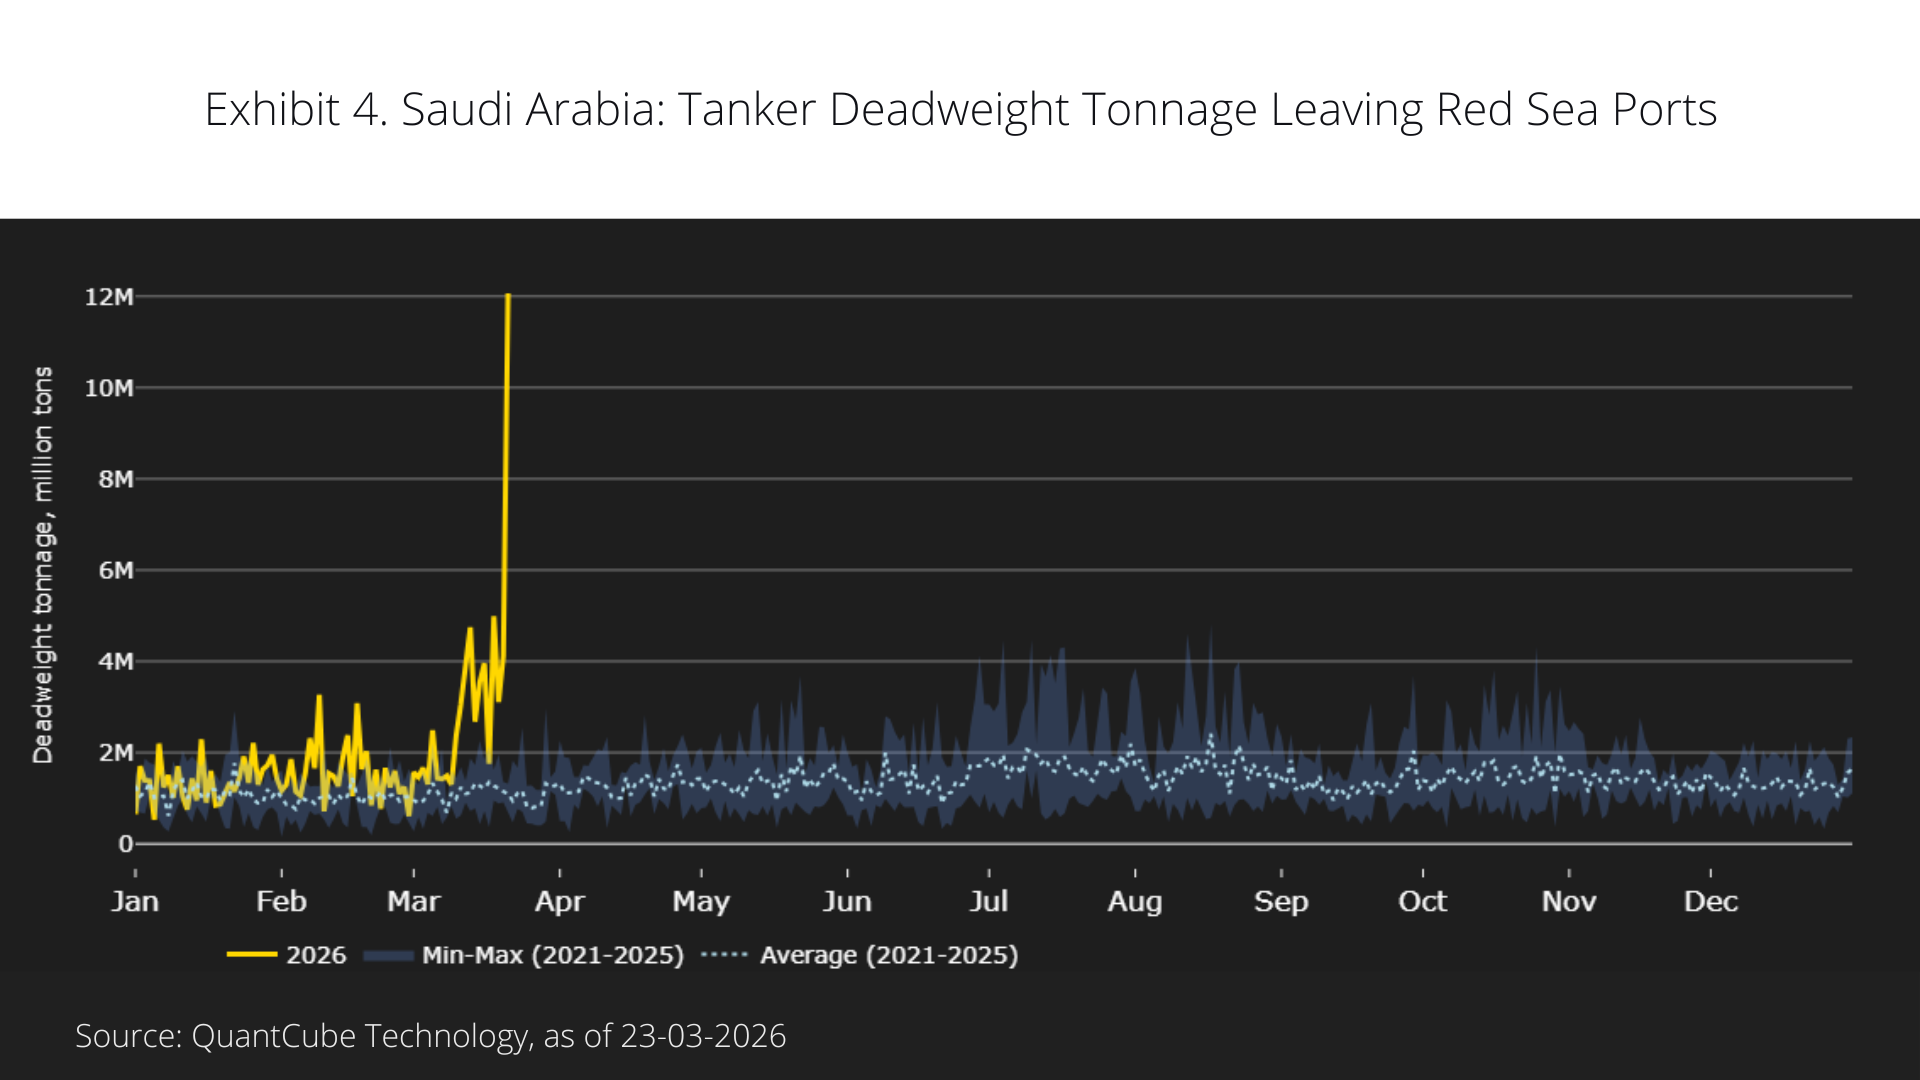
Attention has since shifted to Saudi Arabia’s Red Sea infrastructure, particularly the Petroline corridor to Yanbu. Our latest data shows outbound tonnage from these routes reaching approximately 12 million tons – equivalent to around 85 million barrels of theoretical capacity as Exhibit 4 indicates.
Real-time tracking of these flows provides insight not only into the scale of substitution, but also into its limits. Pipeline capacity, port infrastructure, and vessel availability all act as binding constraints – shaping both the speed and effectiveness of supply chain adaptation.
Why Alternative Data Matters
The strength of maritime data lies in its immediacy and granularity. It provides daily visibility into flows, bottlenecks, and behavioural adjustments – well ahead of official trade or inventory data.
By enabling aggregation across regions and vessel types, it provides a scalable view of global supply chains – from crude oil and LNG to dry bulk and container traffic – allowing investors to monitor disruptions as they unfold.
However, limitations remain. Signal quality depends on accurate polygon calibration, while AIS visibility can decline in conflict zones as vessels reduce transmission to mitigate risk. Distinguishing between strategic anchoring and forced immobilisation also requires careful interpretation of navigation patterns and historical benchmarks.
The Strait of Hormuz shock underscores a growing disconnect between real-time events and lagging macro data. QuantCube’s approach bridges that gap by transforming physical trade flows into actionable signals – capturing both the disruption and the adjustment process as it happens.
As geopolitics becomes an increasingly persistent driver of markets, the ability to anticipate rather than react will define macro edge.
Disclaimer
This website is provided for general informational purposes only and does not purport to be comprehensive or include any representation, warranty, assurance or undertaking. Nothing herein is intended to be advisory or relied upon, nor shall any statement bind QuantCube, its affiliates or successors.
Information provided has not been independently verified and does not constitute an offer or invitation to partake in any transaction, or any sale, purchase or recommendation of any securities or other product or service. Any information contained herein may only be used for your internal use, may not be reproduced or redisseminated in any form, and may not be used as a basis for any financial instruments, products or indices. Nothing herein is intended to provide tax, legal, or investment advice.
This website is provided on an "as is" basis and the recipient assumes the entire risk of any use made of any information contained herein. Historical data and analysis should not be taken as an indication or guarantee of any future performance, forecast or prediction. Market and economic views are subject to change at any time and there can be no assurance that countries, markets or sectors will perform as expected.
Investment involves risks, including market, political, liquidity and currency risks. In no event shall QuantCube or any person involved in the production of this website have any liability whatsoever for any direct, indirect, special, incidental, punitive or consequential damages in relation to the adequacy, accuracy, completeness or reasonableness of this website.