Hormuz in the Dark: What Maritime Data Reveals About Gulf Oil Flows
Macro Insights
Track hidden Gulf oil flows with QuantCube's maritime data
Summary
Crude futures are back above $100 at the December horizon, with the curve inverted. The supply picture is severe: navigation through Hormuz is operating under strict controls, the Houthi blockade is restricting Saudi tanker traffic through Bab el-Mandeb, and the Petroline pipeline has been shut down following a drone strike. Three simultaneous disruptions are affecting the Gulf's main export arteries. And yet prices have not moved as sharply as the headlines might suggest. Explaining that gap requires looking beyond headline flows.
Hormuz Is Not Closed – It Is Hidden
The first thing the data reveals is that Gulf exports have been reduced, not stopped. Tanker traffic through Hormuz has continued in recent weeks – mostly at night, with AIS transponders switched off.
That last point matters for what our indicators can and cannot show. With transponders dark, our maritime tracking loses sight of vessels in the Strait: as of 14 September, we counted two vessels carrying roughly 2 million barrels, compared with 46 vessels and approximately 19 million barrels on 28 February. That gap reflects the constraints of the data as much as the underlying reality.
To recover the signal, we track activity where vessels are likely to re-emerge – particularly the anchorage zones around Fujairah in the Gulf of Oman, the UAE’s primary transshipment hub and a natural relay point for some clandestine Hormuz crossings.
Two mechanics are in play. The first involves small shuttle tankers making the crossing clandestinely and offloading onto larger Suezmax and VLCCs (Very Large Crude Carriers with capacity of up to 2 million barrels) anchored offshore Fujairah. The second involves larger ships making the crossing directly, either sailing straight to their destination or transshipping via Fujairah to smaller vessels better suited to ports with draft constraints along the East African and Indian coastlines.
The Fujairah data is telling (Exhibit 1). On 28 February, 44 tankers were anchored in the area, representing around 10 million barrels of capacity. Activity collapsed after strikes hit the zone, before recovering from late June following the US-Iran MoU – and has held up since the resumption of hostilities in July. As of 14 September, 67 tankers were present, representing approximately 9 million barrels of capacity.
More importantly, vessel turnover in the anchorage zones remains substantial despite the war, pointing to continued transshipment activity rather than simply idle storage. The deadweight tonnage leaving these zones is equivalent to roughly 50% of normal daily Hormuz outflows – a meaningful, if partial, offset to the Strait’s disruption.
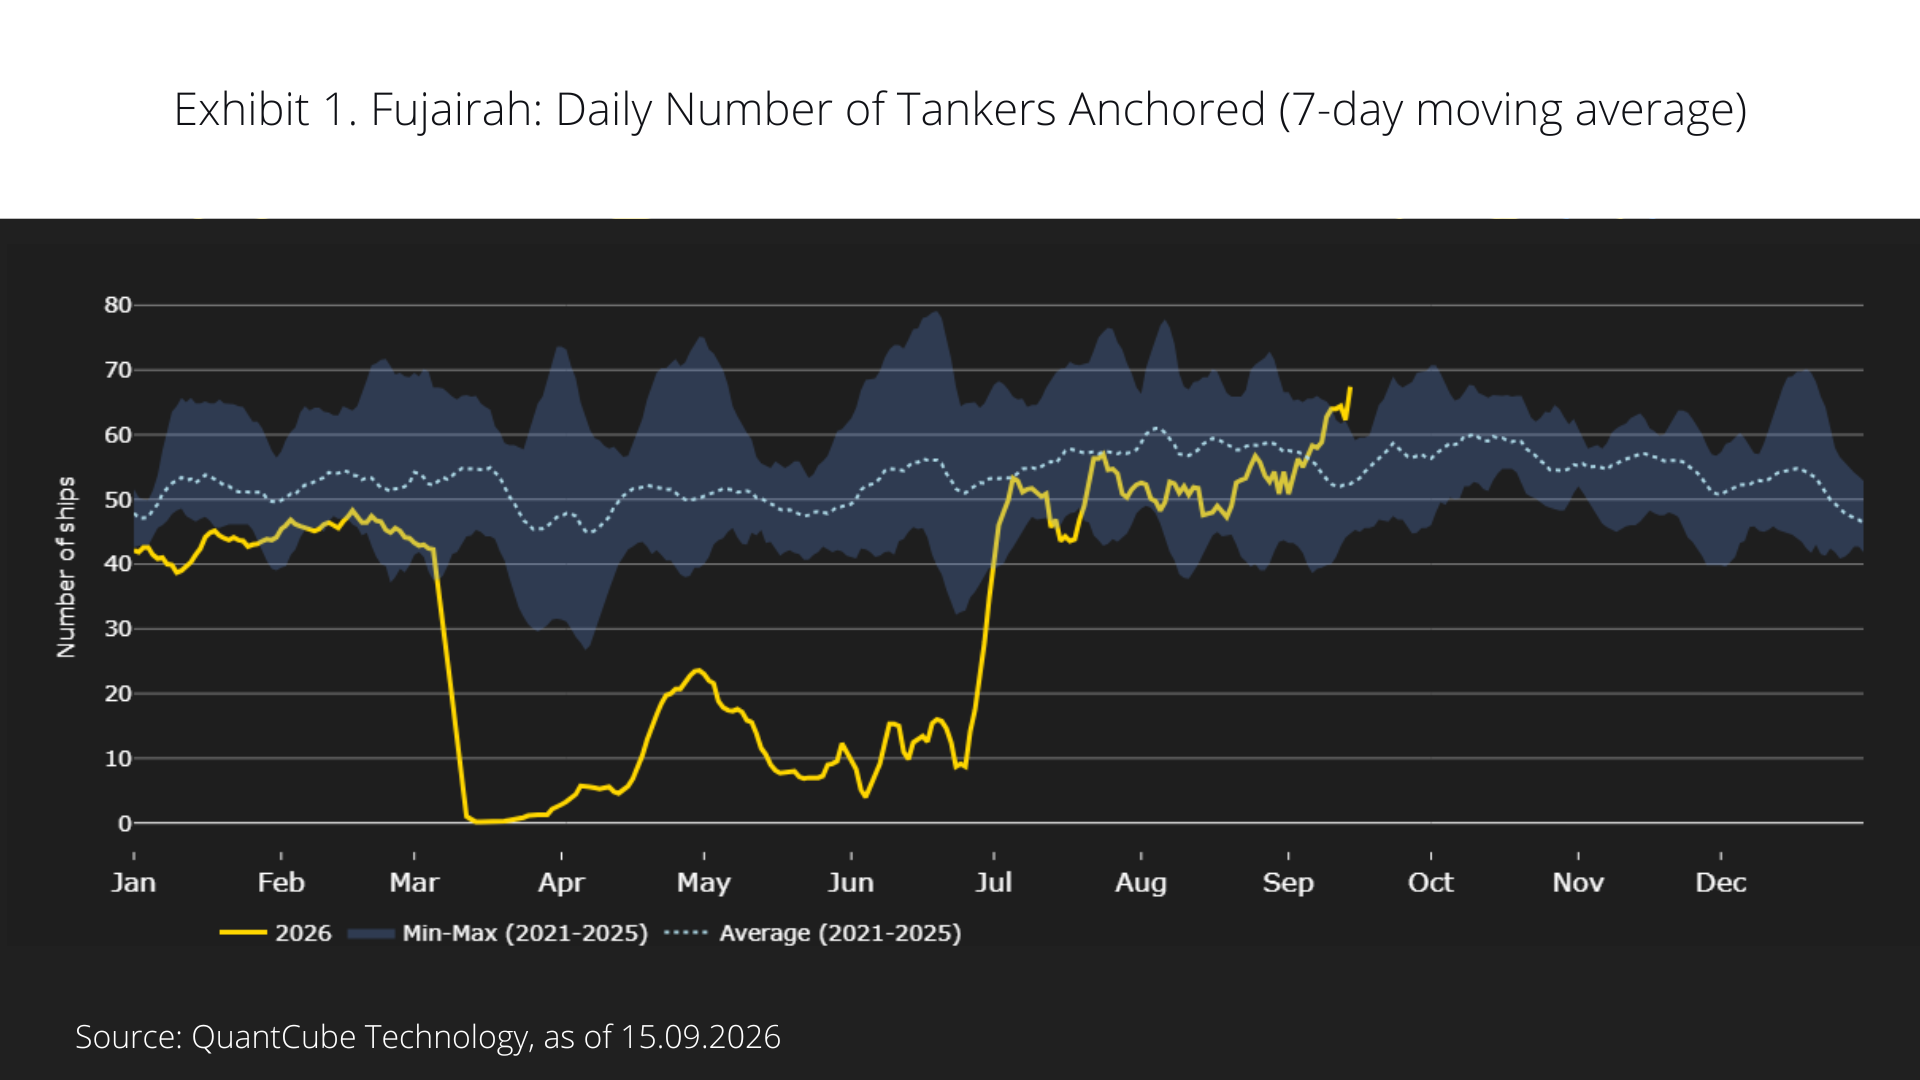
Two caveats apply. Fujairah is also a major bunkering hub, and some tanker presence reflects refuelling rather than transshipment. Our indicators also track deadweight tonnage rather than effective cargo load, meaning empty vessels departing the zone are counted. The indicator is therefore best read as an activity signal – activity versus no activity – rather than a precise estimate of oil volumes.
On that basis, the message is clear: oil is still getting out of the Gulf, in quantities that matter.
The Saudi Escape Route – and Its Closure
Until 12 September, Saudi Arabia had a second outlet. The Petroline pipeline, connecting eastern oil fields to Yanbu on the Red Sea with a maximum capacity of 7 million barrels per day, had been operating at high capacity since March. Between March and late July, an average of 6.5 million barrels of tanker capacity left Yanbu daily.
Flows were partly redirected through Suez and the SUMED pipeline into the Mediterranean – visible in our Suez tanker traffic data (Exhibit 2), which rose as traffic through Bab el-Mandeb declined amid tighter Houthi restrictions on Saudi tanker movements.

The Petroline shutdown has removed that outlet. This helps explain the recent upward move in prices. On current supply conditions, however, a further significant rise would likely require another disruption to Hormuz flows themselves – which Fujairah activity would be one of the first to signal.
The Chinese Demand Cushion
The second reason prices have not risen further is Chinese demand. Since spring, China has cut its seaborne oil imports by approximately 40% relative to late-February levels (Exhibit 3) – a reduction that has proved persistent.
The reduction appears deliberate, and the logic is coherent: avoid buying at elevated prices, draw on strategic reserves, limit inflationary pass-through at a time of subdued domestic demand, and avoid amplifying a price spike that would hurt the trading partners on which China depends for export demand.
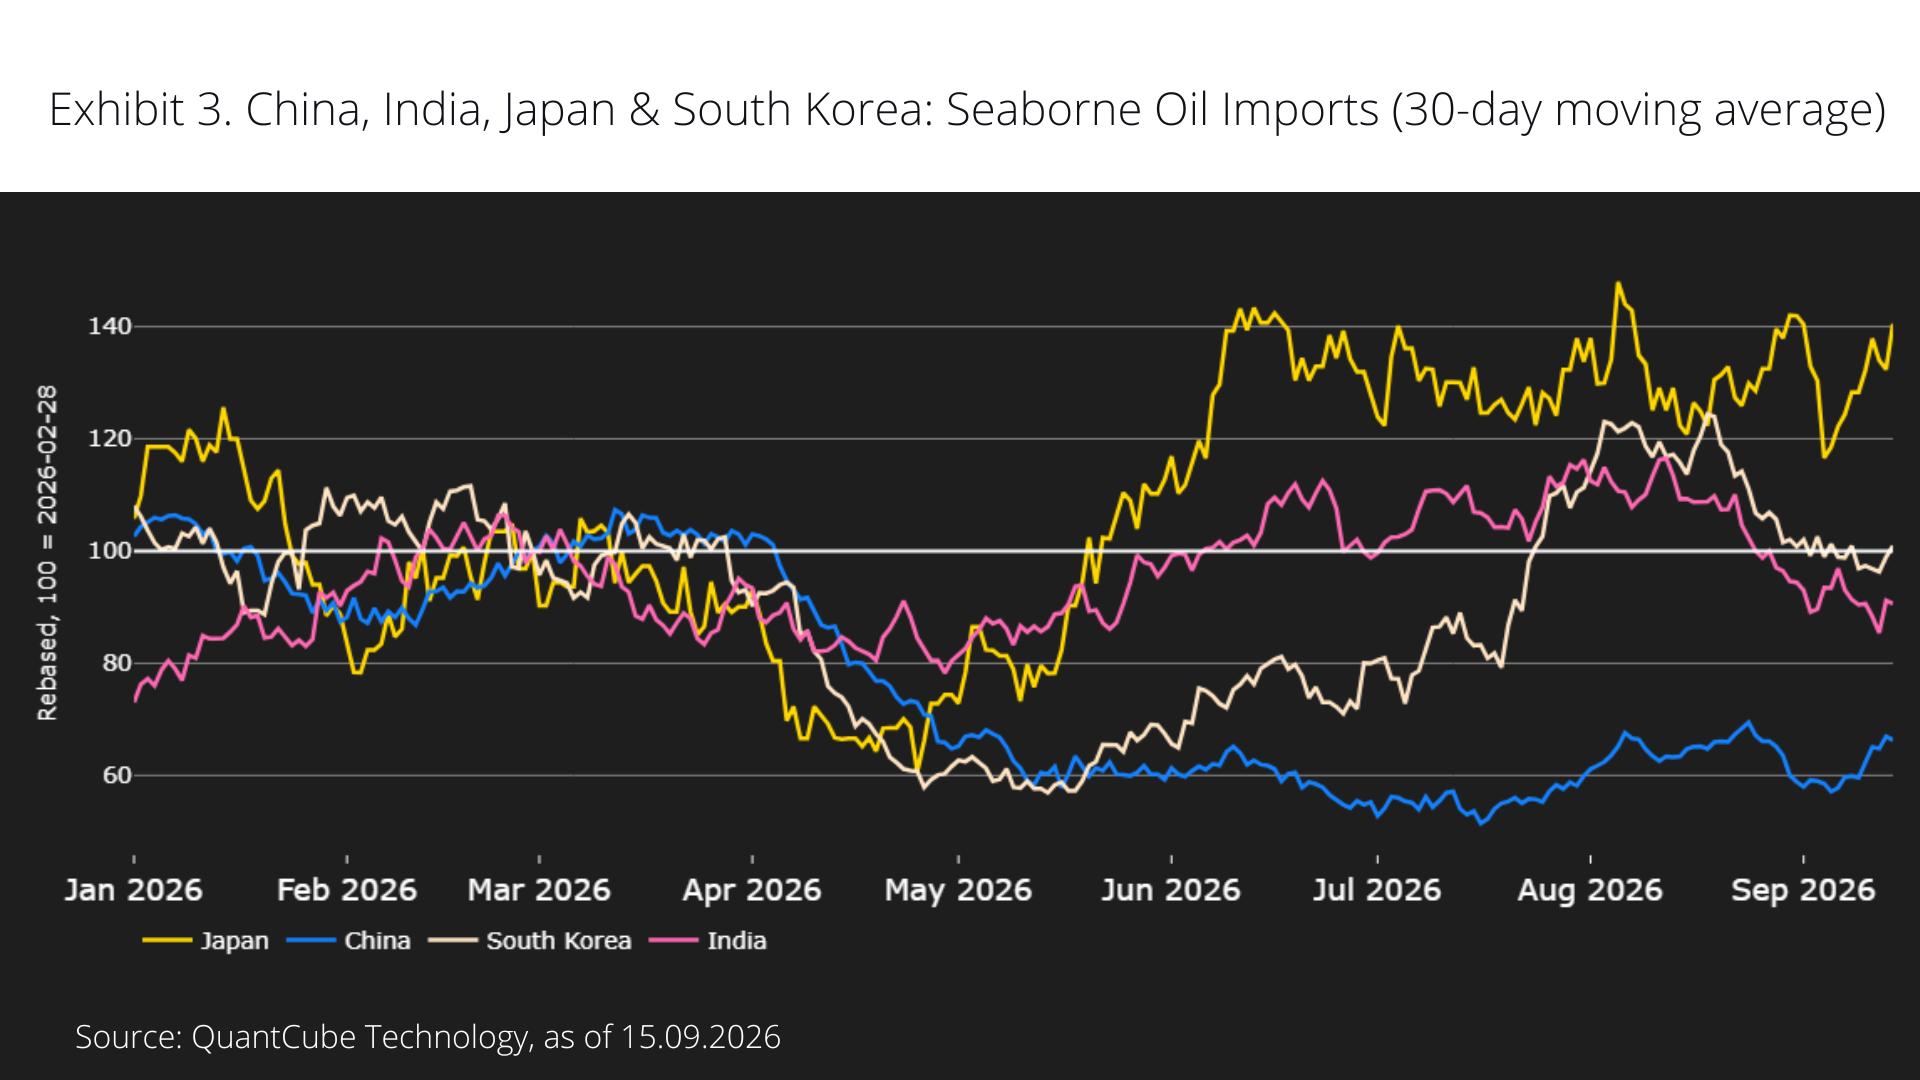
The effect has been to absorb a significant share of the supply shock on the demand side. It also represents an important upside risk to prices from here. A resumption of Chinese seaborne imports in a still-constrained supply environment could put renewed upward pressure on crude – making our China import trackers an important signal to watch.
What the Data Is Telling Us
Current prices reflect a supply environment that is constrained but not broken: clandestine flows through Hormuz appear to be continuing at meaningful levels, proxied by activity around Fujairah; Yanbu is temporarily offline; and weak Chinese demand is acting as a structural buffer.
The next move in oil – up or down – will depend in large part on how those three variables evolve. Our maritime indicators are positioned to track each of them in real time.
Disclaimer
This website is provided for general informational purposes only and does not purport to be comprehensive or include any representation, warranty, assurance or undertaking. Nothing herein is intended to be advisory or relied upon, nor shall any statement bind QuantCube, its affiliates or successors.
Information provided has not been independently verified and does not constitute an offer or invitation to partake in any transaction, or any sale, purchase or recommendation of any securities or other product or service. Any information contained herein may only be used for your internal use, may not be reproduced or redisseminated in any form, and may not be used as a basis for any financial instruments, products or indices. Nothing herein is intended to provide tax, legal, or investment advice.
This website is provided on an "as is" basis and the recipient assumes the entire risk of any use made of any information contained herein. Historical data and analysis should not be taken as an indication or guarantee of any future performance, forecast or prediction. Market and economic views are subject to change at any time and there can be no assurance that countries, markets or sectors will perform as expected.
Investment involves risks, including market, political, liquidity and currency risks. In no event shall QuantCube or any person involved in the production of this website have any liability whatsoever for any direct, indirect, special, incidental, punitive or consequential damages in relation to the adequacy, accuracy, completeness or reasonableness of this website.