Beyond Weather Forecasts: Real-Time Agricultural Intelligence from Satellite Data
Macro Insights
Flag crop stress before official data with QuantCube's Agricultural Nowcast
Summary
Agriculture is moving back up the macro agenda. Disruptions to fertiliser supply chains following the Gulf conflict coincide with the forecasts that the current ENSO (El Niño Southern Oscillation) will intensify into a strong event from August, shifting rainfall patterns across agricultural regions, and keeping temperatures materially above average. Together, these developments could affect crop yields and food prices. They are set to impact the agricultural production cycle well into 2027.
Satellite-Based Agricultural Nowcasting
Official crop yield and production statistics remain fragmented, infrequent, and heavily lagged. QuantCube addresses this by combining satellite imagery with local meteorological observations to monitor crop conditions throughout the growing season, explicitly accounting for the different growth stages of crop development. Because our models observe conditions directly from space rather than relying on weather data alone, they capture the actual evolution of crops as they develop.
QuantCube provides daily, real-time estimates of end-of-season yields and production for the world’s four most traded crops — wheat, rice, corn, and soybeans — covering the 13 largest production countries. Estimates begin from the start of each growing season, months before official statistics become available closer to harvest (Exhibit 1), allowing users to assess the impact of weather shocks and other disruptions as they occur. Across the four commodities, our models show robust correlation with official yield figures and achieve a global RMSPE below 9%.

Early Signs of Agricultural Stress Are Already Emerging
India accounts for roughly one quarter of global rice production and around 40% of exports, making it central to global food markets. Rice production in this part of the world can be particularly sensitive to monsoon rainfall, and forecasts of a strengthening El Niño increase the risk of below-normal rainfall during the remainder of the monsoon season, potentially weighing on yields.
Our estimates for the current season point to production running around 8% below the 2023–2024 season (Exhibit 2), a deterioration worth monitoring as ENSO strengthens. As a reminder, during the previous major ENSO event in 2023, weak harvests contributed to India’s export restrictions, helping push global rice prices to their highest level in 15 years.
Weather alone does not determine crop yields. The impact of a heatwave or drought depends on when it occurs in the crop's development cycle and on other local factors such as irrigation infrastructure, rural support policies and farming practices. Daily pixel-level satellite observations capture these effects directly, allowing us to distinguish between temporary weather disruptions and genuine deterioration in crop conditions.

In North America, the outlook for US winter wheat remains weak. Our estimates for the July harvest point to yields around 13% below the average of the previous three seasons, making this one of the weakest harvests in recent years.
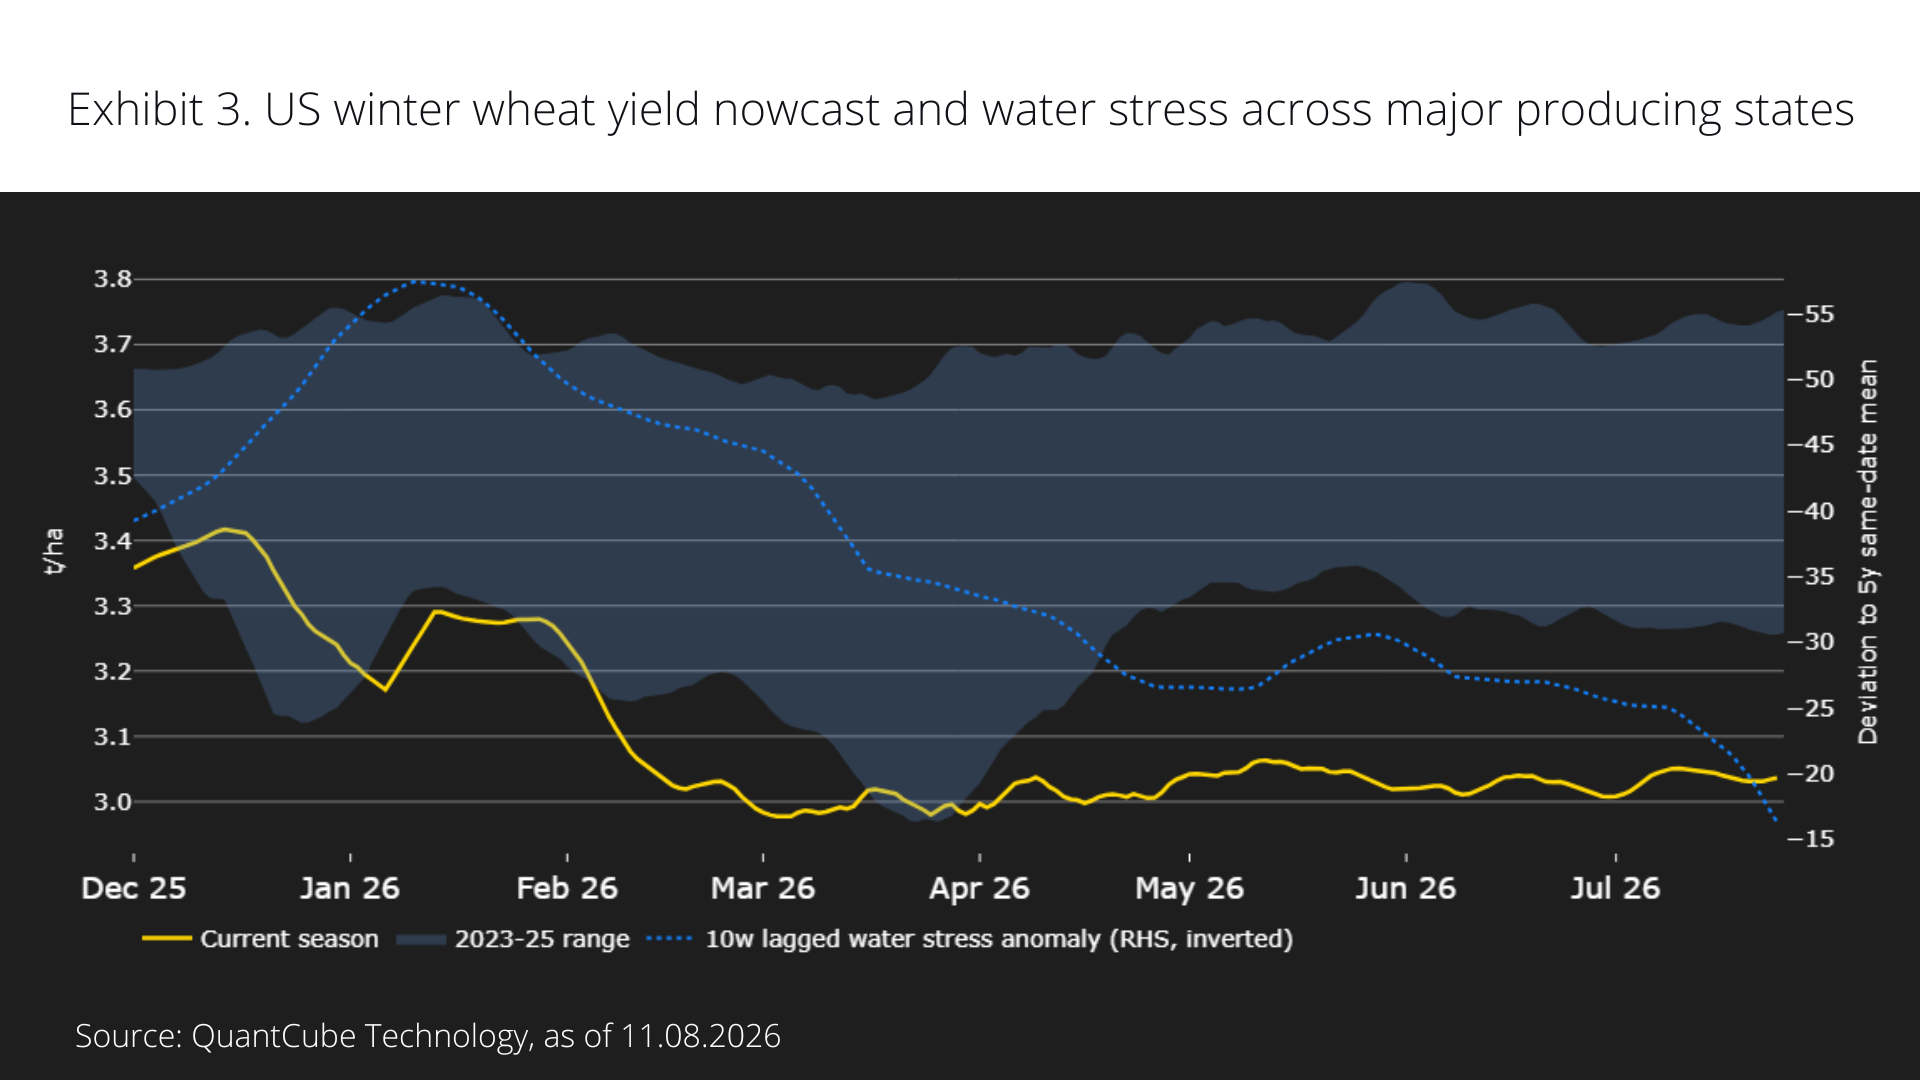
We were signalling this deterioration as early as December (Exhibit 3), months before official agencies began reporting weaker conditions in the spring. Much of the deterioration has tracked worsening water stress across Kansas, Oklahoma, Colorado and Texas, which together account for roughly half of US winter wheat production.
Why It Matters
Real-time production estimates help commodity investors improve both the direction and timing of positioning as a growing season unfolds. For discretionary investors, they provide an early view of supply developments well before official estimates are published. For systematic investors, they offer a timely, objective signal that can be incorporated directly into trading models. Our systematic Kansas Wheat futures strategy, combining the wheat yield nowcast shown in Exhibit 3 with QuantCube’s CPI nowcast, illustrates this value: since 2017, it has generated a 9.3% annualised return versus -6.4% for the BCOM Kansas Wheat benchmark, delivering 8.75% annualised alpha with near-zero beta.
The same signals also strengthen macroeconomic analysis and policy monitoring. For economists and investors, early visibility on crop yields and production improves assessments of food inflation when combined with other market drivers such as inventories, trade flows and demand. For policymakers, these indicators provide an early warning of emerging food security risks, whether driven by weaker domestic harvests or disruptions to imported supply. As climate volatility becomes more frequent, the ability to detect agricultural stress before it appears in official statistics will become increasingly valuable.
Current coverage focuses on the world’s four most heavily traded crops – wheat, rice, corn and soybeans - across 13 major producing countries. While these markets represent a substantial share of global agricultural production and trade, yield and production estimates should be interpreted alongside inventories, demand and production outside the current coverage universe when assessing price risks. Used together, however, they provide an objective, real-time view of global agricultural supply months before official data become available.
Disclaimer
This website is provided for general informational purposes only and does not purport to be comprehensive or include any representation, warranty, assurance or undertaking. Nothing herein is intended to be advisory or relied upon, nor shall any statement bind QuantCube, its affiliates or successors.
Information provided has not been independently verified and does not constitute an offer or invitation to partake in any transaction, or any sale, purchase or recommendation of any securities or other product or service. Any information contained herein may only be used for your internal use, may not be reproduced or redisseminated in any form, and may not be used as a basis for any financial instruments, products or indices. Nothing herein is intended to provide tax, legal, or investment advice.
This website is provided on an "as is" basis and the recipient assumes the entire risk of any use made of any information contained herein. Historical data and analysis should not be taken as an indication or guarantee of any future performance, forecast or prediction. Market and economic views are subject to change at any time and there can be no assurance that countries, markets or sectors will perform as expected.
Investment involves risks, including market, political, liquidity and currency risks. In no event shall QuantCube or any person involved in the production of this website have any liability whatsoever for any direct, indirect, special, incidental, punitive or consequential damages in relation to the adequacy, accuracy, completeness or reasonableness of this website.