From Systematic Signals to Discretionary Decisions: Adapting Risk-On/Risk-Off for Portfolio Allocation

Macro Insights
QuantCube’s Risk-On/Risk-Off framework for discretionary allocation
Summary
In February, we introduced QuantCube’s Risk-On/Risk-Off (RoRo) signal in our newsletter, Beyond the Quadrant: A Risk-On/Risk-Off Framework for a Fragmented World, initially designed to provide systematic traders with a daily directional view on S&P 500 futures. We have now adapted the same signal to a discretionary investment framework, where rebalancing is less frequent and may occur only a few times per year.
Rather than simply indicating whether markets are risk-on or risk-off, this complementary approach translates the strength of the signal into recommended equity portfolio weights, providing a quantitative input to investment decisions. The framework is flexible, allowing investors to adjust their equity exposure according to their investment horizon and risk constraints.
Our analysis suggests that the signal can deliver meaningful risk-adjusted returns even with infrequent rebalancing. It also reveals opportunities for investors who prefer to act only when market signals are particularly strong.
From Daily Trading Signals to Portfolio Allocation
The original RoRo signal combines three of QuantCube’s real-time macroeconomic and geopolitical indicators (Chinese growth, US inflation, and global geopolitical risk), each capturing a different driver of market sentiment. Together, these indicators generate a composite score between 0 and 1, with readings above 0.1 indicating risk-on conditions. Importantly, each component’s contribution is transparent, allowing investors to understand what is driving changes in market sentiment.
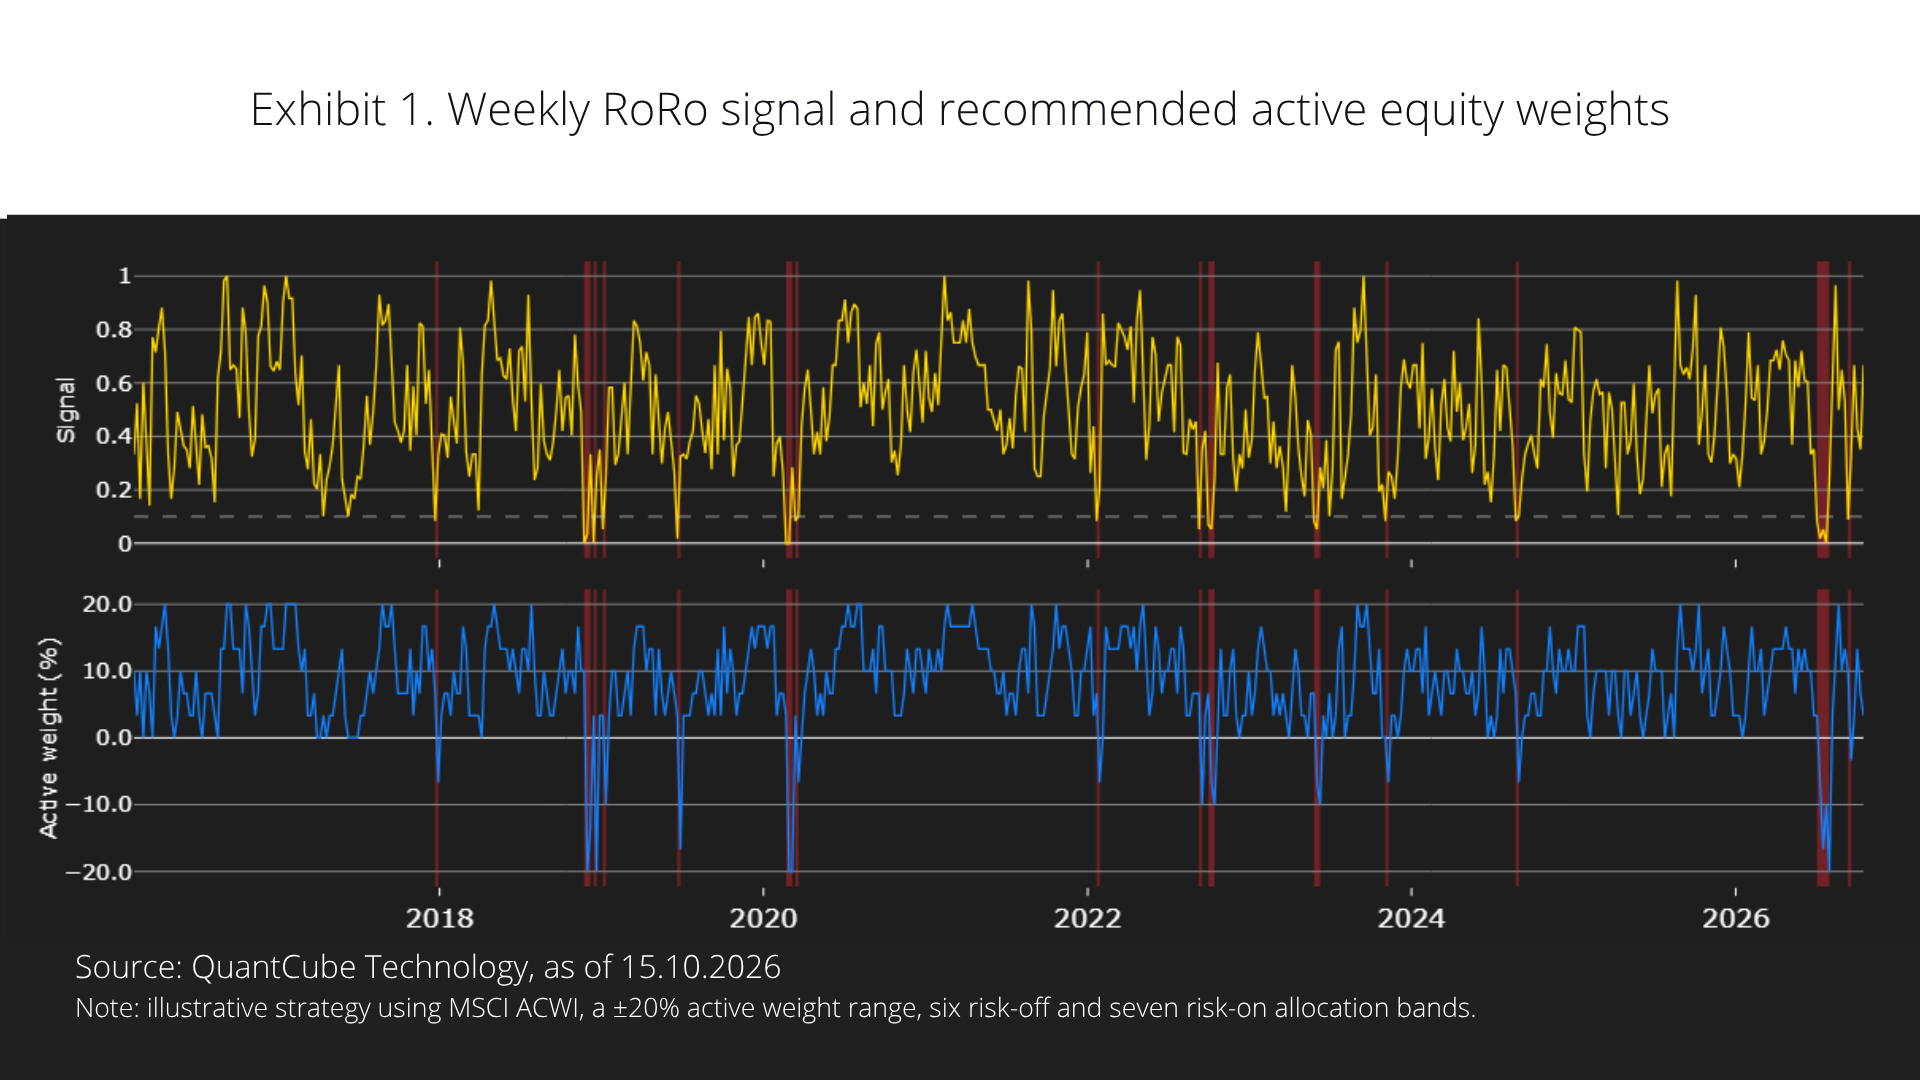
We then translate the signal into weekly recommended equity allocations, using the median of daily readings to reduce short-term noise. Using the MSCI All Country World Index (ACWI) as a proxy for a diversified global equity portfolio, our illustration allows active weights to vary between 20% underweight and 20% overweight relative to the benchmark allocation. The risk-on segment of the signal is mapped from neutral to maximum overweight, while the risk-off segment maps onto the underweight range, with each divided into equal-width allocation bands.
Rather than switching abruptly between risk-on and risk-off positions, the framework adjusts exposure in increments, depending on the strength of the signal. Investors can customise both the allocation range and the number of bands to suit their own investment constraints. Our illustration uses six underweight and seven risk-on bands, giving steps of just over 3 percentage points.
Exhibit 1 illustrates how the weekly RoRo signal translates into recommended equity allocations over time. It highlights an important characteristic of the signal: risk-on conditions tend to persist, while risk-off episodes are relatively brief. Since 2016, risk-on periods have lasted an average of 33.5 weeks, compared with less than two weeks for underweight episodes. As a result, the framework generally recommends maintaining an equity overweight, adjusting its size as market conditions evolve and reducing exposure during periods of heightened risk.
For discretionary investors, the value lies not simply in identifying market turning points, but in providing a disciplined approach to managing equity exposure throughout the market cycle.
Can the Signal Add Value with Less Frequent Rebalancing?
With infrequent rebalancing (monthly, quarterly, or even annually), performance depends on which dates happen to be chosen, so we tested the sensitivity to rebalancing schedules in two ways.
First, we examined the strategy’s historical performance from 2016 to 2026 across randomised rebalancing schedules. At each review date, the investor reads the signal and applies the corresponding recommended weight.
We simulated 5,000 alternative rebalancing calendars at frequencies ranging from once to twelve times per year. The results were encouraging: across every frequency tested, at least 75% of simulations achieved an information ratio above 0.3, while at least 75% generated annualised active returns exceeding 0.6%.
We then subjected the strategy to a more extensive robustness test, generating 10,000 alternative market histories and varying the timing of portfolio adjustments within each. This allowed us to assess whether the results depended heavily on the particular sequence of historical market conditions.
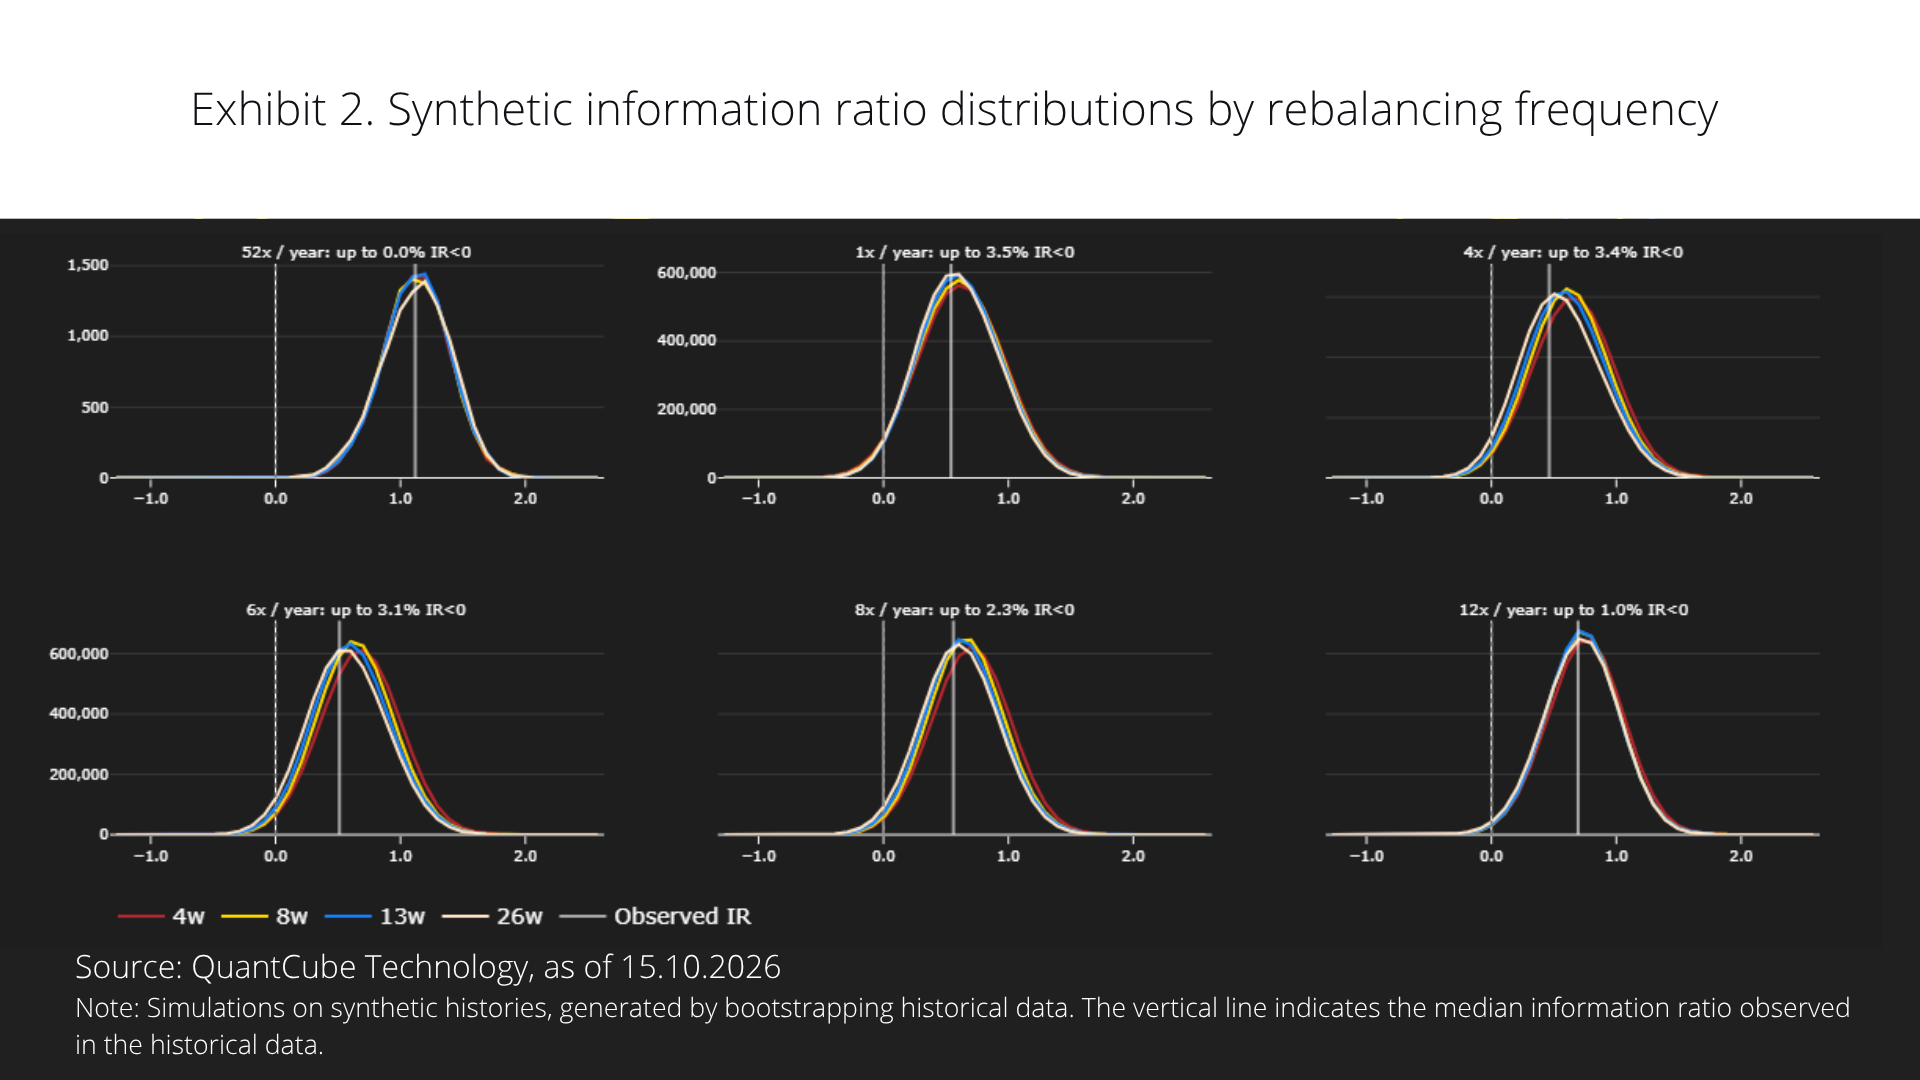
Exhibit 2 shows the distribution of simulated information ratios across different rebalancing frequencies and market scenarios. Across the simulations, no more than 3.5% of information ratios were negative at any frequency tested. Moreover, the information ratio observed in the historical data sits close to the centre of the simulated distributions, suggesting that the strategy’s performance was not simply the result of unusually favourable market conditions.
For discretionary investors, the implication is significant: the RoRo signal can potentially enhance portfolio allocation decisions without requiring frequent trading or continuous portfolio adjustments.
A More Selective Approach: Acting on High-Conviction Signals
Some investors may prefer to maintain their strategic allocation most of the time and act only when the signal indicates unusually strong market conditions.
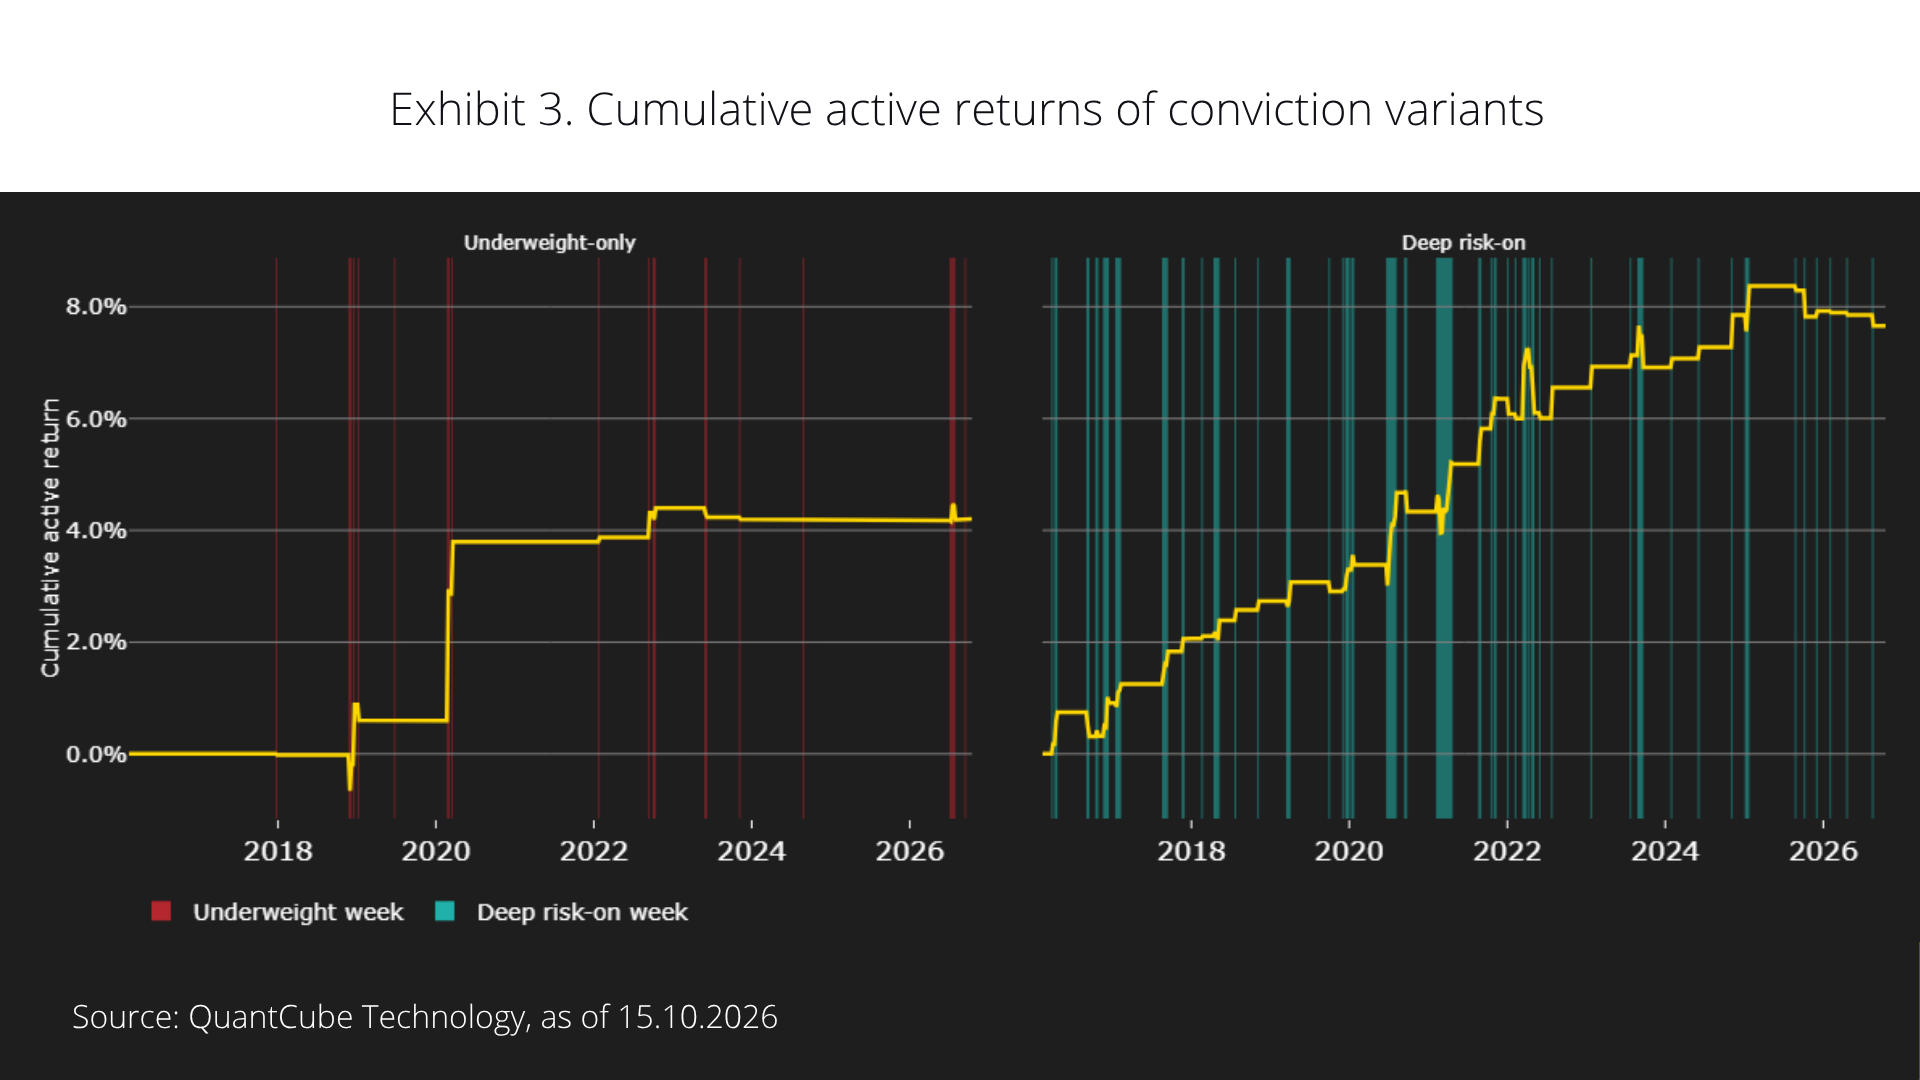
We therefore tested two more selective approaches, focusing separately on defensive positioning and strong risk-on opportunities. Exhibit 3 compares their cumulative active returns since 2016.
The first, an underweight-only strategy, reduces equity exposure during risk-off episodes (4% of the weeks in our sample) but otherwise maintains a neutral position. Despite this limited activity, the strategy captured parts of several major market turning points, including the Covid-19 sell-off, generating approximately 4% in cumulative active returns over the benchmark.
The second, a deep risk-on variant, takes the full overweight only when the reading lands in the top two bands, indicating particularly strong risk-on conditions (signal above 0.74). These high-conviction opportunities occurred in 16% of weeks and generated just under 8% in cumulative active returns since 2016.
These results highlight the flexibility of the framework and suggest that investors do not need to respond to every change in market sentiment to benefit from the signal. Investors seeking downside protection can focus on defensive signals, while those looking to capture upside opportunities can concentrate on periods of particularly strong risk appetite.
Timing Macro Signals into Actionable Portfolio Decisions
The broader lesson is that systematic macro signals need not be confined to high-frequency trading strategies.
By translating QuantCube’s real-time macroeconomic and geopolitical indicators into graduated portfolio recommendations, the RoRo framework provides discretionary investors with a disciplined, transparent way to incorporate changing market conditions into their allocation decisions.
Our analysis suggests that this approach can add value across different rebalancing frequencies, while more selective strategies offer additional flexibility for investors with specific risk preferences.
The limitations flagged in February nevertheless remain relevant. The inflation component interprets rising price momentum as a sign of stronger demand, and therefore as bullish, potentially misreading a supply-driven stagflationary episode. The geopolitical component covers only a subset of market-moving events and could be extended both geographically and in scope by incorporating other sentiment measures.
The objective is not to replace discretionary judgement, but to strengthen it with timely, data-driven signals that help investors decide when – and by how much – to adjust their equity exposure.
Disclaimer
This website is provided for general informational purposes only and does not purport to be comprehensive or include any representation, warranty, assurance or undertaking. Nothing herein is intended to be advisory or relied upon, nor shall any statement bind QuantCube, its affiliates or successors.
Information provided has not been independently verified and does not constitute an offer or invitation to partake in any transaction, or any sale, purchase or recommendation of any securities or other product or service. Any information contained herein may only be used for your internal use, may not be reproduced or redisseminated in any form, and may not be used as a basis for any financial instruments, products or indices. Nothing herein is intended to provide tax, legal, or investment advice.
This website is provided on an "as is" basis and the recipient assumes the entire risk of any use made of any information contained herein. Historical data and analysis should not be taken as an indication or guarantee of any future performance, forecast or prediction. Market and economic views are subject to change at any time and there can be no assurance that countries, markets or sectors will perform as expected.
Investment involves risks, including market, political, liquidity and currency risks. In no event shall QuantCube or any person involved in the production of this website have any liability whatsoever for any direct, indirect, special, incidental, punitive or consequential damages in relation to the adequacy, accuracy, completeness or reasonableness of this website.