
Reading Germany’s Industrial Pulse from Space
Macro Insights
QuantCube’s latest insights into the German economic outlook
Summary
Germany’s prolonged industrial slowdown has emerged as one of Europe’s defining macro themes since the late 2010s. From 2018 onwards, its industrial base has been hit by an unusual confluence of structural shocks: a painful transition in the automotive sector from internal combustion engines to electric vehicles, a persistent rise in production costs driven by wages and energy prices, and an abrupt intensification of Chinese competition across both autos and capital goods. The macroeconomic consequences are well documented - stagnant GDP since 2019 and a pronounced decline in industrial production.
In 2025, the political response marked a clear regime shift. The arrival of Friedrich Merz, alongside a more confrontational US stance towards Europe, triggered a decisive pivot in German policy. Fiscal orthodoxy was set aside in favour of a large-scale stimulus programme, with significant investment earmarked for industry, defense, infrastructure, and the ecological transition. Almost immediately, clients began asking the same question: are we already seeing signs that this pivot is working?
At the aggregate level, the answer remains not yet. While policy announcements came swiftly, concrete budgetary implementation only materialised towards the autumn. Traditional macro indicators - including our German GDP nowcast - are too aggregated and too slow-moving to capture early inflection points. To detect weak signals, we need to look directly at where the stimulus is intended to operate: industrial production itself.
From Macro Aggregates to Factory Gates
This challenge led us to explore an alternative perspective: observing production activity from space. As a pilot, we focused on the automotive sector – both because it sits at the core of Germany’s industrial ecosystem and because it is under the greatest competitive pressure from China’s rapid electrification push.
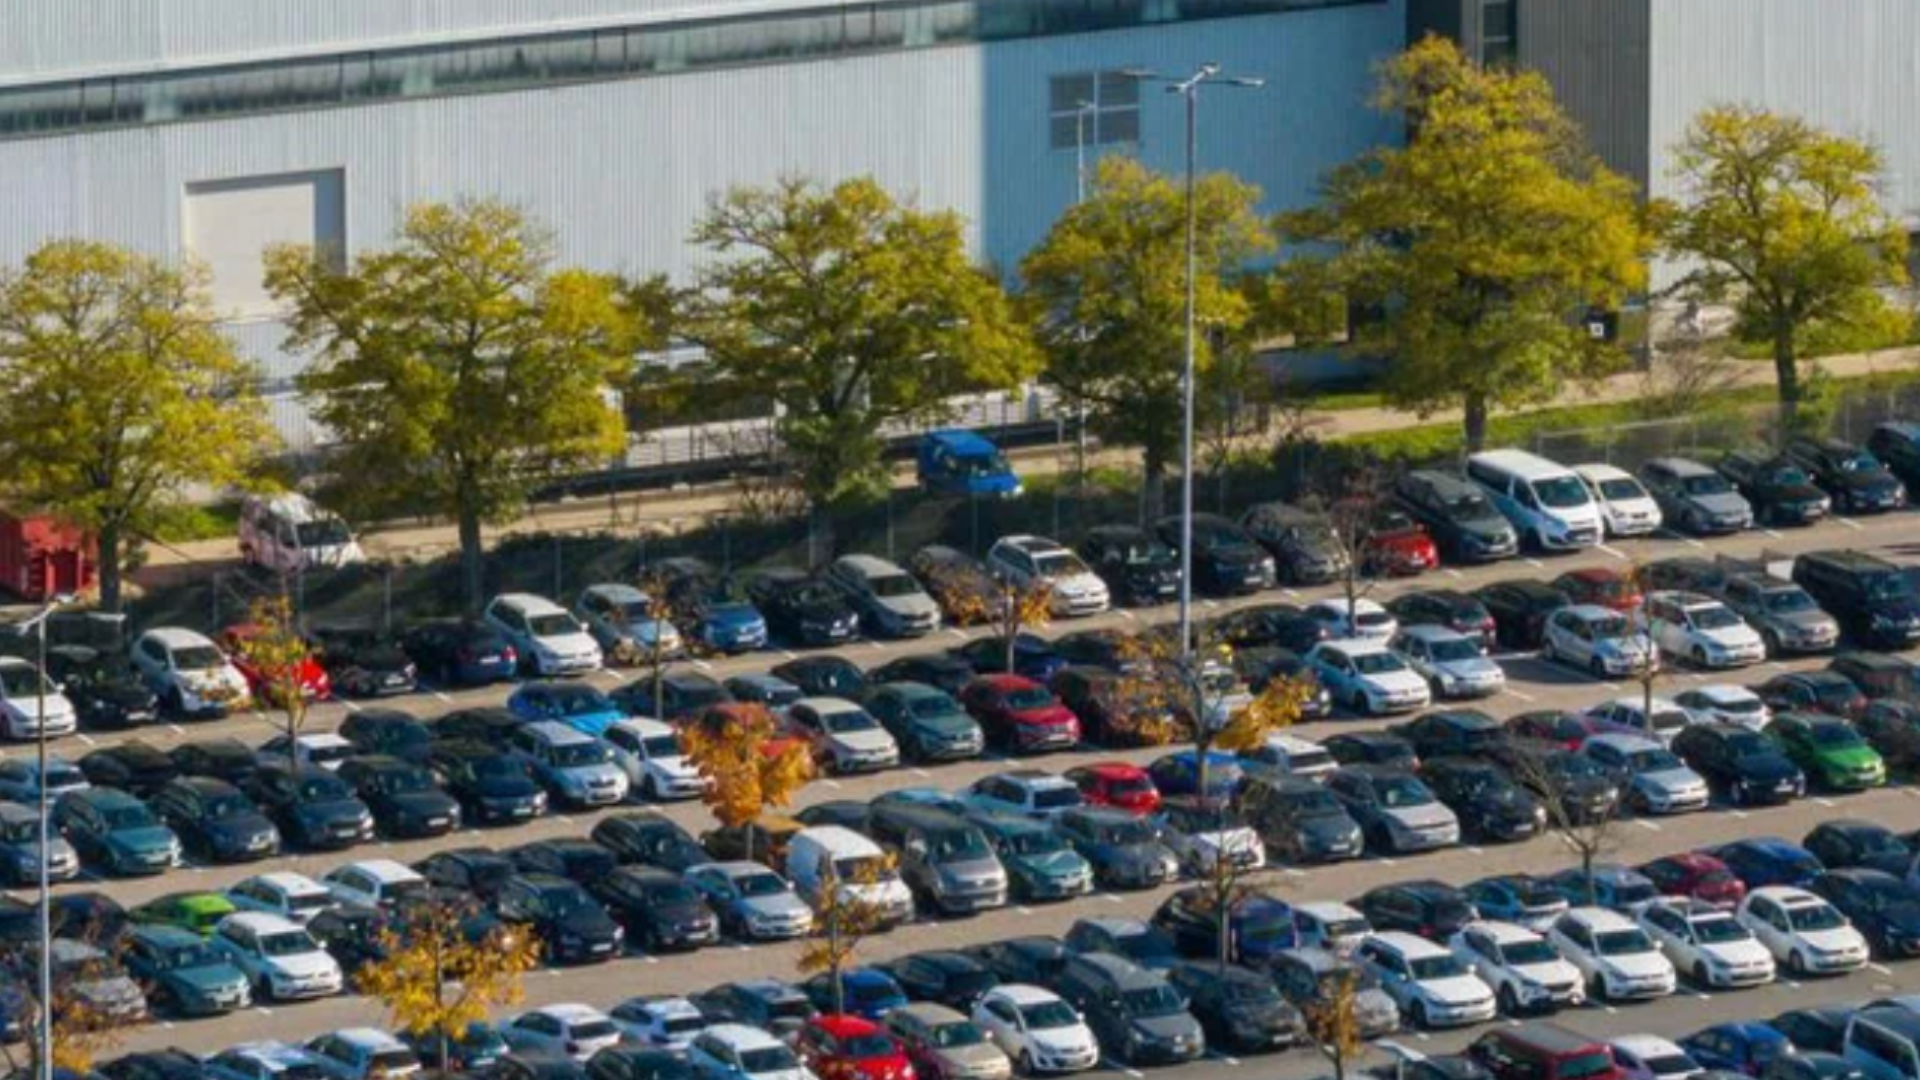
The underlying intuition is straightforward. Changes in production volumes tend to be reflected in on-site logistics activity, particularly parking utilisation around factories where finished output is stored. Using radar imagery from the Sentinel-1 satellite – which operates independently of weather conditions – combined with QuantCube’s proprietary Asset Mapping Database, we monitor parking density around automotive production facilities on a weekly basis. Computer-vision techniques convert 10m x 10m satellite images into parking density indices at the site level.
In Germany, we currently track 19 automotive production units, covering almost 100% of national car production and nearly all major brands operating in the country (Exhibit 1). Because we observe the characteristics of each facility – production capacity, model mix, and powertrain composition –these parking-based indicators can be translated into an approximate daily measure of vehicles output on a 30-day rolling window. When aggregated nationally, this satellite-derived series tracks official Destatis car production data remarkably well as Exhibit 2 demonstrates, despite differences in scope and methodology.

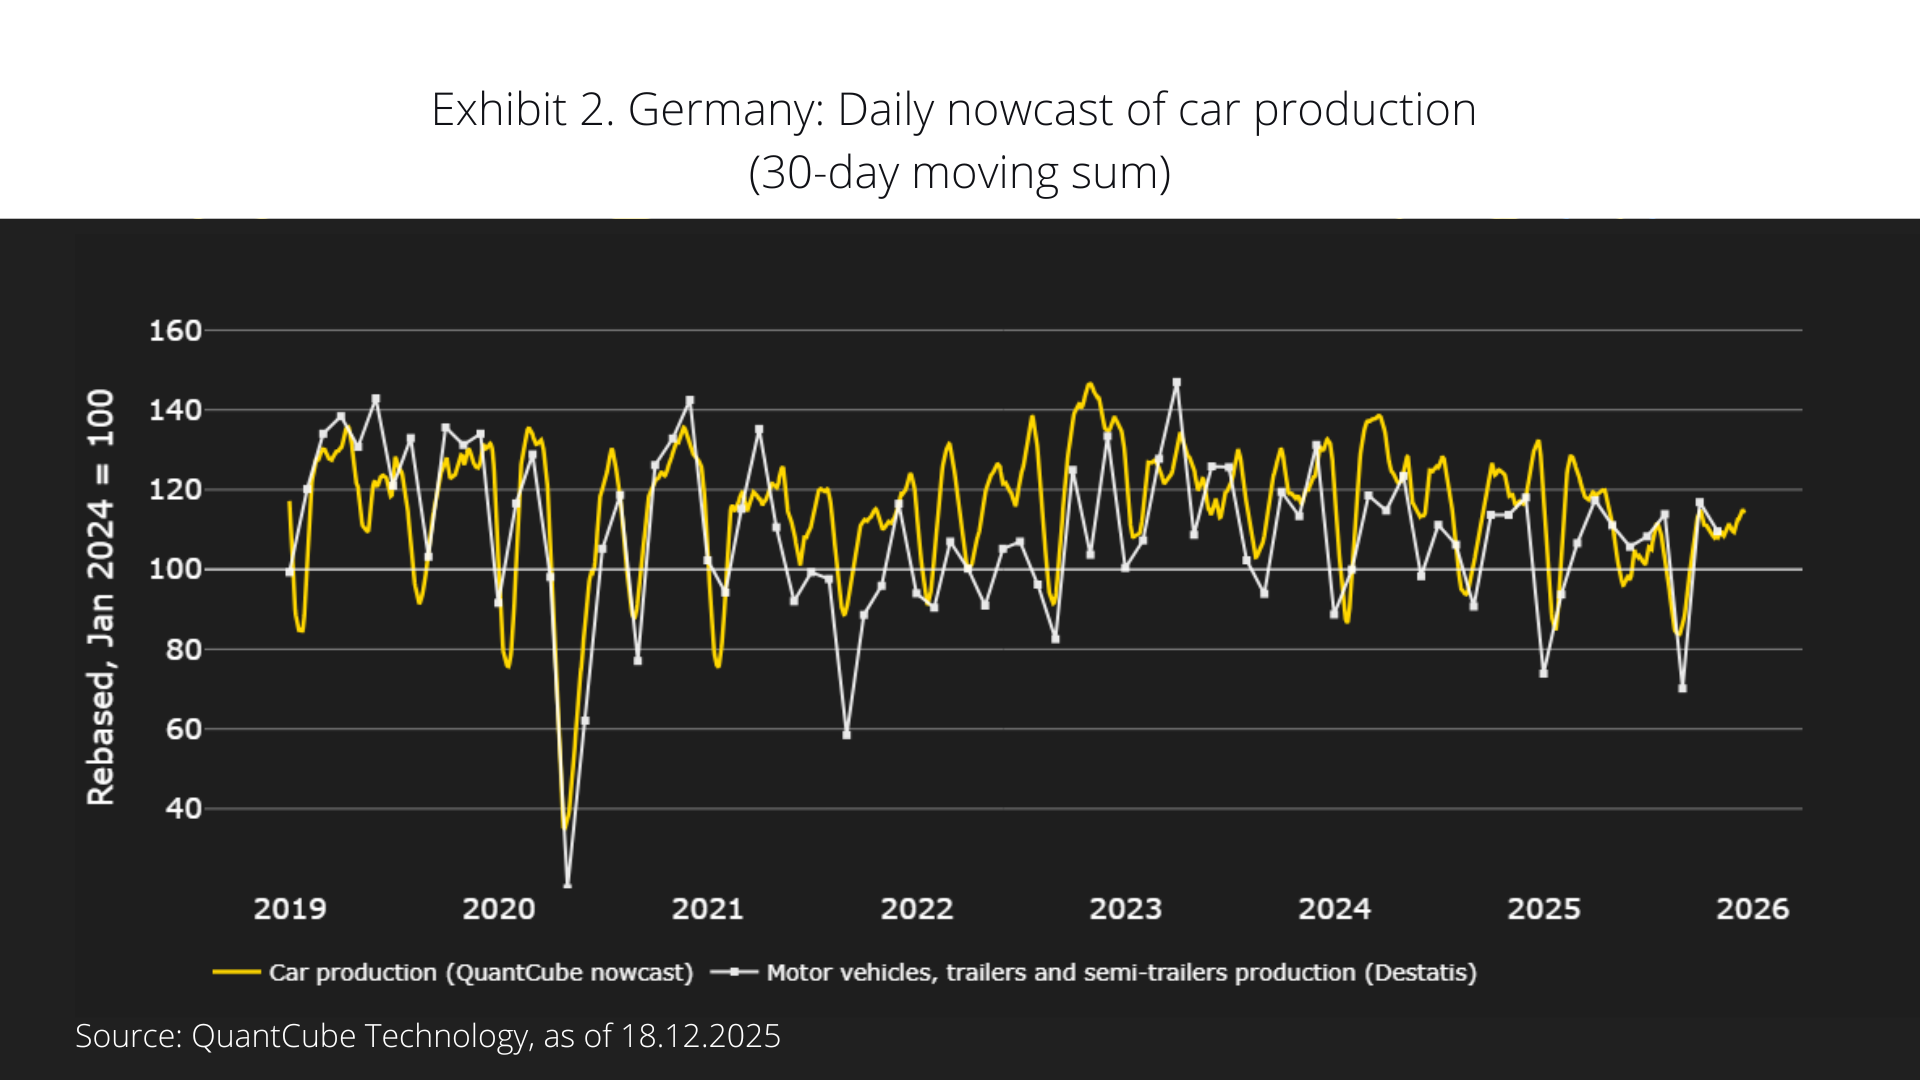
The key advantage is timing. With weekly satellite observations and lengthy publication lags for official statistics, this approach delivers a nowcast that runs nearly six weeks ahead of official data releases.
What the Data Is Telling Us
So far, the message from space is cautious rather than celebratory. Our car production nowcast confirms that German automotive output remains well below its pre-2019 levels, with no clear evidence yet of a broad-based rebound following the fiscal announcements. This is consistent with the implementation lag of public investment and with persistent demand uncertainty across key export markets.
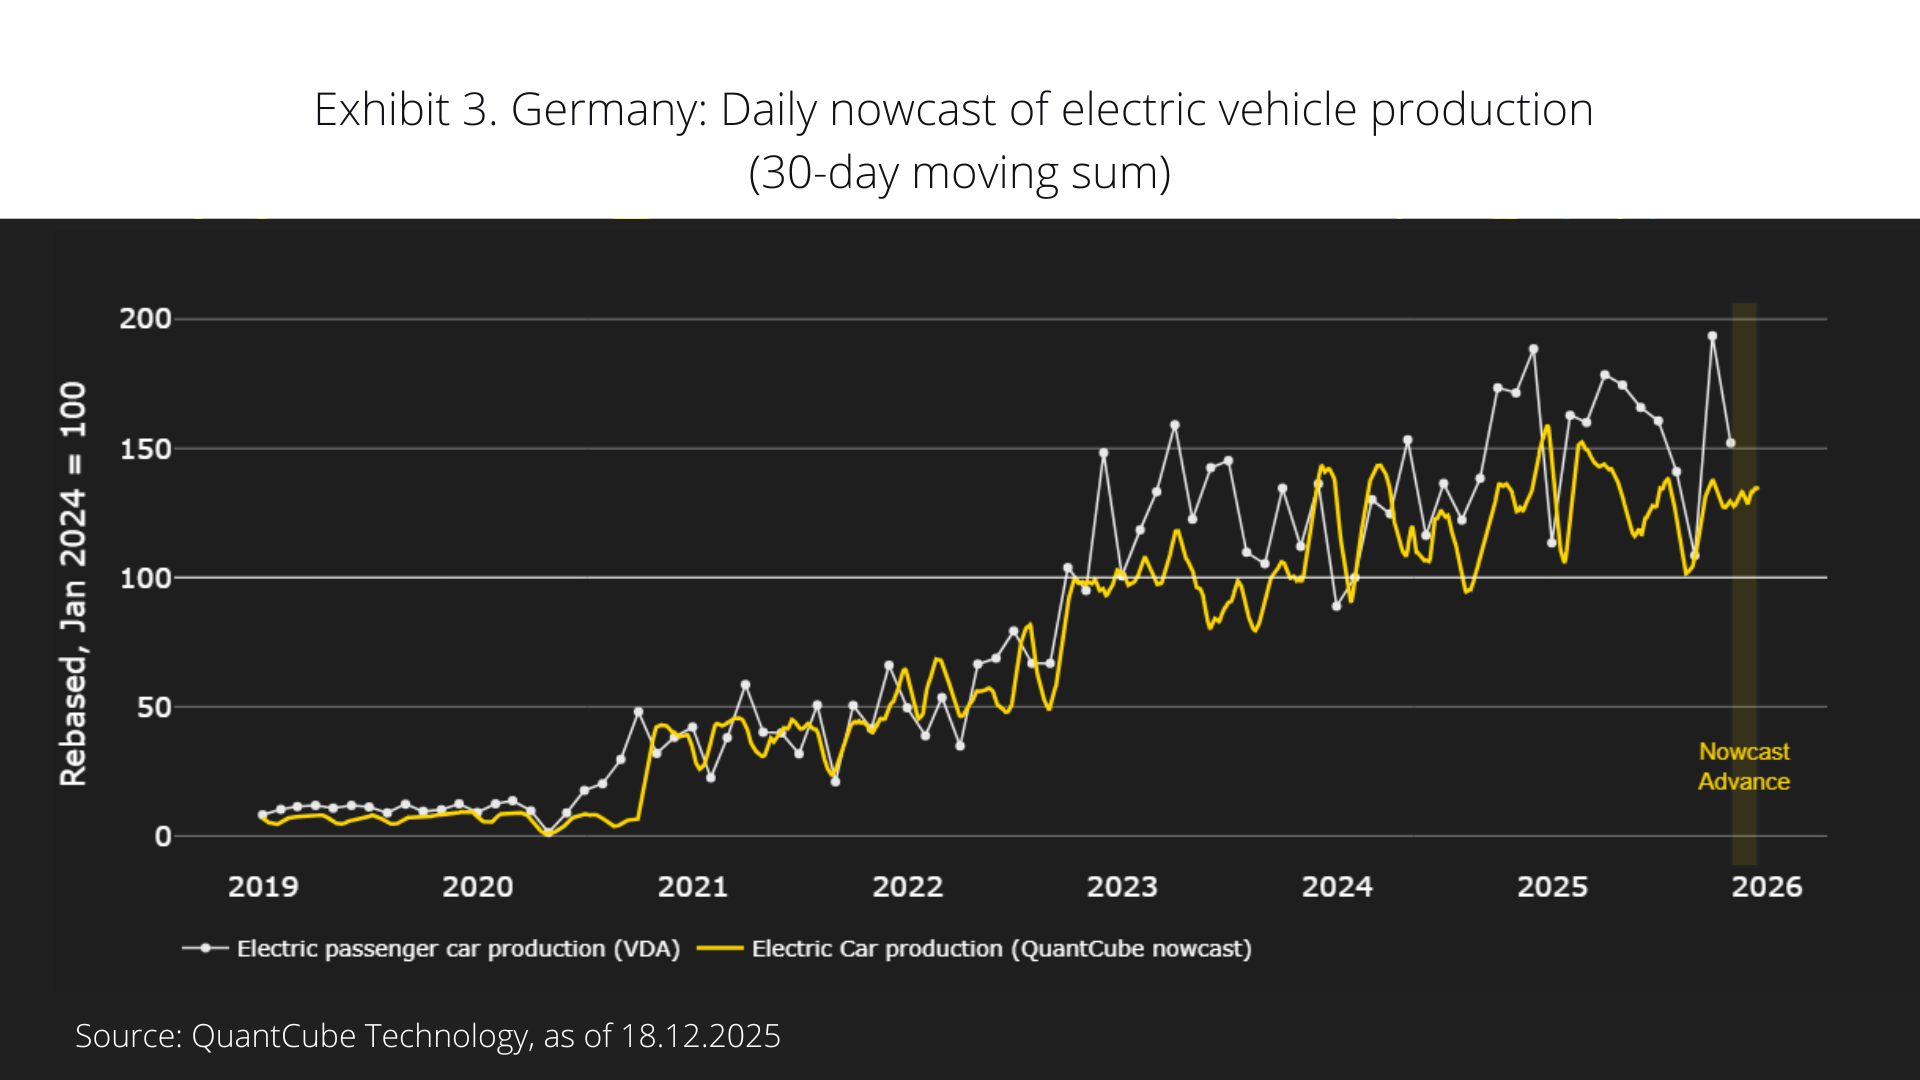
That said, the disaggregated view reveals nuances that are invisible in aggregate statistics. Electric-vehicle production continues to rise on a relative basis, even as overall volumes remain subdued. The satellite-derived EV production nowcast shows a gradual but persistent increase, broadly aligned with industry data from the VDA (Exhibit 3). This suggests that elements of the structural adjustment within German manufacturing are progressing - albeit slowly and unevenly.
Crucially, factory-level granularity allows us to distinguish between sites and brands that are adapting effectively to the new competitive environment and those that are continuing to retrench. For investors, this matters. Germany’s industrial story is no longer a single macro narrative, but a collection of diverging micro trajectories.
Beyond Germany, Beyond Autos
This satellite-based framework is not limited to one country or one sector. The same asset-mapping methodology has already been deployed across other European economies and the United States, where our vehicle production nowcast performs well against BEA benchmarks (Exhibit 4).
R&D efforts are underway to extend coverage to China, where official data opacity makes alternative indicators particularly valuable. Beyond autos, we are also exploring applications in European defense manufacturing and large-scale retail activity, where physical footprint and logistics intensity offer similar information advantages.

There are, of course, limitations. Covered or indoor parking reduces visibility, making dense urban or vertically integrated sites harder to analyse – posing challenges for scaling in countries such as Japan. Satellite data does not replace traditional statistics; it complements them.
Why It Matters
For nowcasting models, these indicators enhance our ability to detect turning points in industrial cycles before they appear in GDP or industrial production releases. For market participants, they offer a way to monitor policy transmission in near real time, helping to separate genuine economic signals from political noise.
Germany’s fiscal pivot is real, but its effects will take time to materialise. As of late 2025, satellite-based production indicators suggest that the recovery remains more promise than reality. The value lies in knowing precisely when that assessment begins to change.